• Chinese Journal of Lasers
  • Vol. 49, Issue 24, 2407205 (2022)
Xiaoxue Zhong, Guowu Huang, Hongbo Miu, Chenghao Hu, Wei Liu, Chunrong Sun, Zhihua Chen, Gangning Li, Zili Cao, Xin Jin, and Weihao Lin*
Author Affiliations
  • College of Optometry (College of Biomedical Engineering), Wenzhou Medical University, Wenzhou 325035, Zhejiang, China
  • show less
    DOI: 10.3788/CJL202249.2407205 Cite this Article Set citation alerts
    Xiaoxue Zhong, Guowu Huang, Hongbo Miu, Chenghao Hu, Wei Liu, Chunrong Sun, Zhihua Chen, Gangning Li, Zili Cao, Xin Jin, Weihao Lin. Noninvasive Quantitative Assessment of Burn Degree Based on Spatial Frequency-Domain Imaging[J]. Chinese Journal of Lasers, 2022, 49(24): 2407205 Copy Citation Text show less
    Two-frequency MTF (DC versus AC) lookup table for rapid calculation of optical parameters (μa and μs')
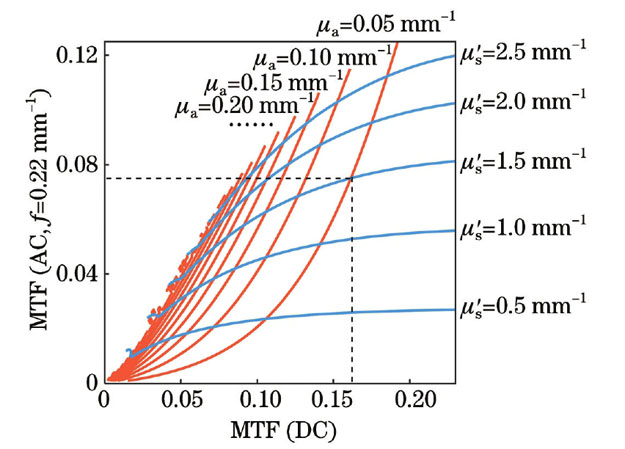
    Fig. 1. Two-frequency MTF (DC versus AC) lookup table for rapid calculation of optical parameters (μa and μs')
    Portable quantitative burn imager. (a) Device physical map; (b) optical path schematic
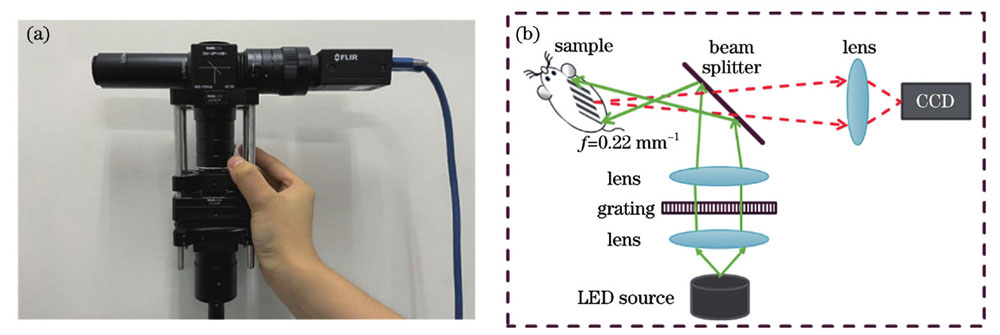
    Fig. 2. Portable quantitative burn imager. (a) Device physical map; (b) optical path schematic
    Time distribution of dorsal burns in SD rats
    Fig. 3. Time distribution of dorsal burns in SD rats
    Data processing flowchart and data visualization interface. (a) Data processing flowchart; (b) data visualization interface
    Fig. 4. Data processing flowchart and data visualization interface. (a) Data processing flowchart; (b) data visualization interface
    Pictures of rat burn skin. (a) Before burn (blank group); (b) 4 s group; (c) 12 s group; (d) 24 s group
    Fig. 5. Pictures of rat burn skin. (a) Before burn (blank group); (b) 4 s group; (c) 12 s group; (d) 24 s group
    Variation of optical parameters of three groups of different burn areas with time under three wavelengths (the parameter value corresponding to each time period is the average value of ROI area, and its standard deviation is also given. Mann-Whitney U-test is used to compare the differences of data, and the level of significant difference is represented by“*”and * represents P<0.05).(a)-(c) Relative change of absorption coefficient of burn area to the area before burn at each time period under R, G, B wavelengths; (d)-(f) relative change of reduced scattering coefficient of burn area to the area before burn at each time period under R, G, B wavelengths
    Fig. 6. Variation of optical parameters of three groups of different burn areas with time under three wavelengths (the parameter value corresponding to each time period is the average value of ROI area, and its standard deviation is also given. Mann-Whitney U-test is used to compare the differences of data, and the level of significant difference is represented by“*”and * represents P<0.05).(a)-(c) Relative change of absorption coefficient of burn area to the area before burn at each time period under R, G, B wavelengths; (d)-(f) relative change of reduced scattering coefficient of burn area to the area before burn at each time period under R, G, B wavelengths
    Systematic clustering. (a) Systematic clustering flowchart; (b) aggregation coefficient line chart
    Fig. 7. Systematic clustering. (a) Systematic clustering flowchart; (b) aggregation coefficient line chart
    Systematic clustering results. (a) 10 min after burn; (b) 120 min after burn
    Fig. 8. Systematic clustering results. (a) 10 min after burn; (b) 120 min after burn
    Factor boxplot at different burn stages. (a) 5 min after burn; (b) 10 min after burn; (c) 30 min after burn; (d) 60 min after burn; (e) 90 min after burn; (f) 120 min after burn
    Fig. 9. Factor boxplot at different burn stages. (a) 5 min after burn; (b) 10 min after burn; (c) 30 min after burn; (d) 60 min after burn; (e) 90 min after burn; (f) 120 min after burn
    Period after burn /minAccuracy /%
    583.33
    1081.33
    30100
    60100
    90100
    120100
    Table 1. Systematic clustering classification accuracy
    Optical parameterFAC1FAC2
    μa for R wavelength0.930-0.143
    μa for G wavelength0.960-0.173
    μa for B wavelength0.818-0.419
    μs' for R wavelength-0.3160.923
    μs' for G wavelength-0.2150.971
    μs' for B wavelength-0.1580.976
    Table 2. Factor loading for optical parameters
    Xiaoxue Zhong, Guowu Huang, Hongbo Miu, Chenghao Hu, Wei Liu, Chunrong Sun, Zhihua Chen, Gangning Li, Zili Cao, Xin Jin, Weihao Lin. Noninvasive Quantitative Assessment of Burn Degree Based on Spatial Frequency-Domain Imaging[J]. Chinese Journal of Lasers, 2022, 49(24): 2407205
    Download Citation