
Miao Zhao, Fengming Liu, Yang Yu, Xinjun Guo, Hao Ruan, Jing Wen. Fast dual-beam alignment method for stimulated emission depletion microscopy using aggregation-induced emission dye resin[J]. Chinese Optics Letters, 2022, 20(11): 113601
- Chinese Optics Letters
- Vol. 20, Issue 11, 113601 (2022)
Abstract
Keywords
1. Introduction
The optical diffraction barrier has always been an ultimate constrain for researchers in exploring the nanoscale world. The emergence of stimulated emission depletion (STED) technology has proven to be a deterministic functional technique in providing a subversive way to erupt this limitation[
Conventional dual-beam alignment is usually accomplished by scanning gold nanoparticles with two laser beams individually and then matching their positions by adaptive position adjustment. This adaptive adjustment requires multiple scans of two laser beams, which is certainly time-consuming, and there is always a trade-off between the scan speed and the resolution of the image. Besides, there are several disadvantages such as mismatches between the scattering and the fluorescence modes and drift errors caused by non-real-time observation. Adaptive optics with the inclusion of a spatial light modulator is implemented for automatic alignment of STED microscopies by directly imaging fluorescent samples[
To solve the aforementioned problems, this study proposes a novel, fast dual-beam adjustment method for STED microscopies, which directly measures the aggregation-induced emission (AIE) fluorescence spectrum from the labeled spots in the tetraphenylethene (TPE)-doped resin. The position of the first excitation beam is recorded by fabricating the labeled spot. Thus, it does not require scanning the first excitation beam. Furthermore, randomly distributed nanoparticles in conventional methods are easy to aggregate, while our method overcomes it by manually fabricating the deterministic labeled spots. We choose AIE dye resin, as it can form deterministic AIE fluorescence spots. Besides, multiple combinations of excitation and depletion beam wavelengths are possible. Furthermore, the fast-dynamic observation of the fluorescence spectrum of labeled spots can eliminate drift errors[
Sign up for Chinese Optics Letters TOC. Get the latest issue of Chinese Optics Letters delivered right to you!Sign up now
2. Experiment
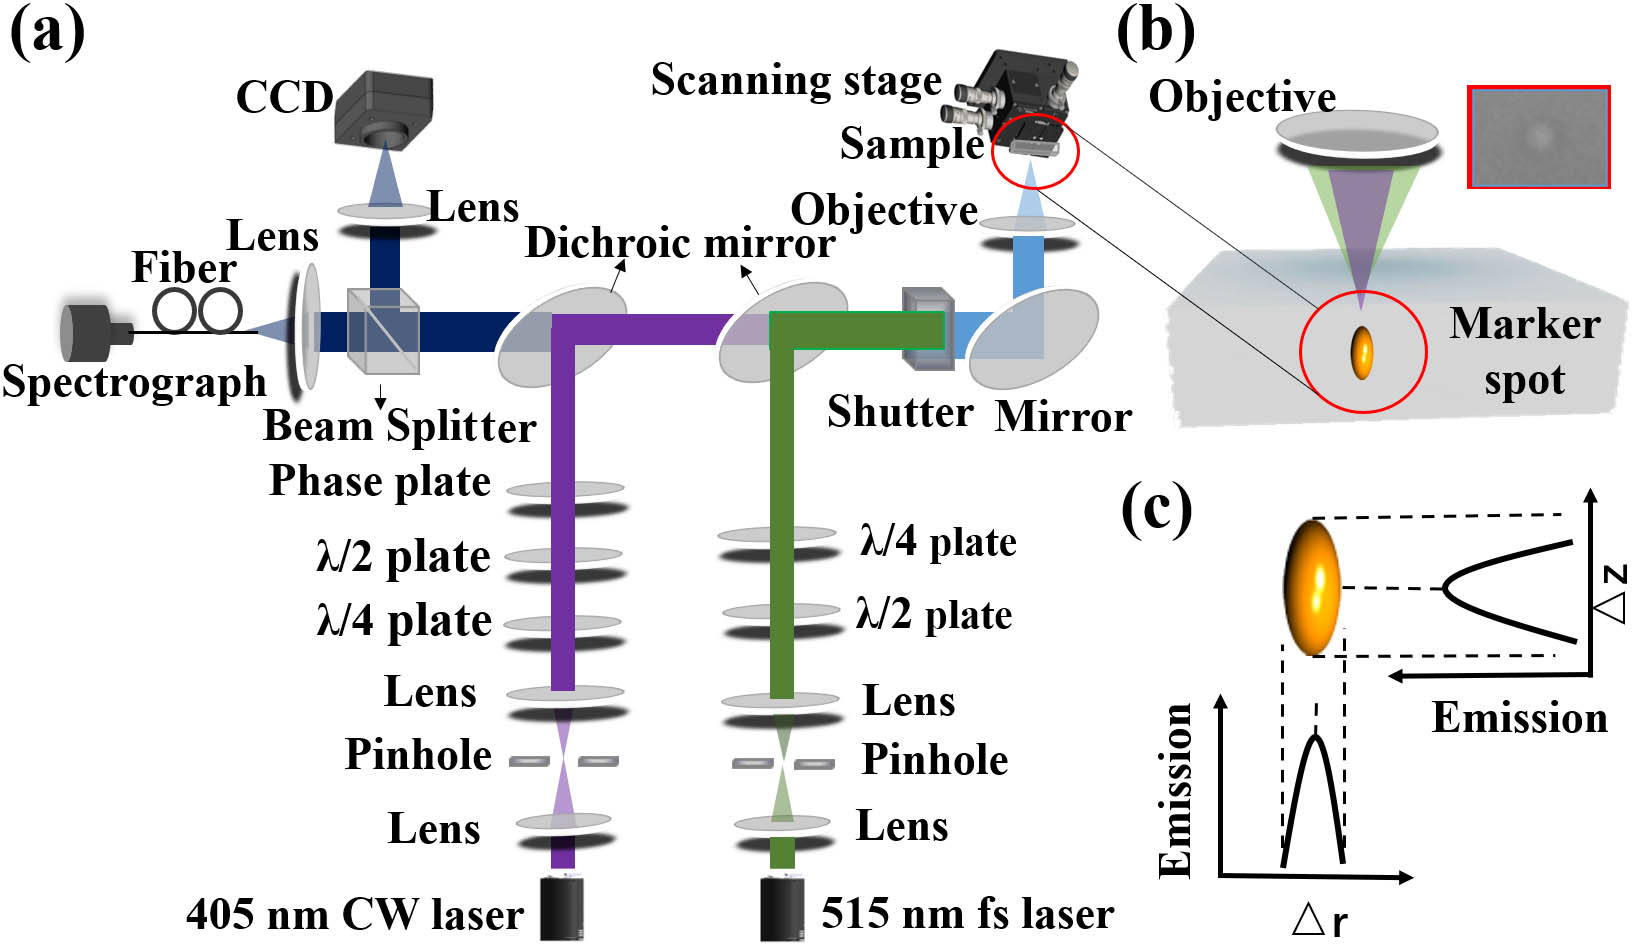
The STED system of dual-beams’ adjustment is illustrated in Fig. 1(a). The Gaussian-shaped excitation beam is a 515 nm femtosecond (fs) laser at a repetition rate of 40 MHz with 500 fs pulse width. The other inhibition beam is a 405 nm CW laser with a doughnut shape. The process of alignment of two beams of a laser is to initially write a fluorescent-labeled spot inside the material based on the polymerization reaction of the photo-initiator in the resin and the 515 nm fs excitation laser. This labeled spot contains the exact 3D position information of the excitation beam [Fig. 1(b)] and generates the AIE effect on the curing sample. The polymerization process is the reaction of the first laser beam and photo-initiator, which is a prerequisite for the fluorescence emission of the aggregated AIE excited by the first and second laser beams of the STED system for the dual-beams’ adjustment in the later steps. The type of the first laser is not limited to a fs pulsed laser, but also can be other pulsed or CW lasers, as long as the wavelength of the first laser falls in the absorption band of the selected photo-initiator. Then, the second inhibition beam requires adjustment, resulting in reduced adjustment time. Finally, the 3D coincident adjustment is achieved expeditiously by detecting the variation of fluorescence intensity through the spectrometer instead of raster scanning spatial distributions of the two laser beams. The camera shown on the left side of Fig. 1(a) is used for coarse pre-alignment first. The fluorescence intensity will be at its peak when there is no spatial mismatch between the excitation and the inhibition laser beams, both along the lateral direction of the relative displacement and relative displacement axes [Fig. 1(c)]. It is worth noting that for dual-beam spatial adjustment, inhibition beams of STED microscopes are not used to inhibit but to excite the spontaneous emission of the AIE-based fluorescent sample with TPE. Our AIE-based fluorescent material is for beam alignment, and the imaging sample for STED microscopies will be changed to other different types of materials.
![]()
Figure 1.Principle of alignment optical setup for dual-beam STED microscopy. (a) Schematic diagram of dual-beam adjustment optical path. (b) The writing process of the labeled spot by the excitation beam. (c) Distribution of each fluorescence intensity at the peak versus lateral and axial mismatches between the excitation beam and the inhibition beam.
For the preparation of the AIE TPE-doped resin, the five-functional monomer dipentaerythritol pentaacrylate (DTPA), TPE dye, 2-hydroxy-2-merthylpropiophenone (HMPP), and photo-initiator 1173 were all provided by Sigma. The monomer DTPA, TPE dye, HMPP, and photo-initiator 1173 were dissolved in acetone and later mixed uniformly by ultrasonic vibration. To remove the acetone, the sample material was kept in the oven at 50°C for 12 h. Afterward, the sample material was assembled by dropping about 0.5 mL resist onto the slide and compressing another slide to clamp the photoresist between them, which were separated by a 40 µm thick tape spacer. Thereafter, the material was cured by a high-power (200 W) hand-held UV irradiation for 20 s.
Different from the conventional dyes, the AIE-based fluorescent radiation’s intensity increases with the increase of aggregation state[
![]()
Figure 2.Fluorescent properties of AIE-induced dye resin sample with and without TPE. (a) Fluorescence spectra of dye resin sample with and without TPE, and both emission spectra are excited by the 370 nm laser. (b) Selection of AIE dyes with different inhibition beams.
For the first step, as the power of the 515 nm fs laser beam increases, the feature size of the labeled spot will also increase. Lecia SP8 confocal microscopy was performed at the National Center for Protein Science Shanghai to get the measurement result in Fig. 3(a). As the power of the excitation beam reaches 0.2 mW, the labeled spot size is 230 nm. When the power is increased to 0.3 mW, the size is 271 nm. The power of the excitation beam is further increased to 0.7 mW, and the size could reach 396 nm [Fig. 3(a)]. Thus, for the alignment process, the excitation beam power is chosen to be 0.3 mW since it can form an appropriate feature size of the labeled spot, which should not be too small. If the lateral size is too small, the alignment accuracy will be enhanced, but the observation of the fluorescence intensity will be challenging due to the rather weak signal. Meanwhile, the accuracy of the dynamic position adjustment of the two beams depends on the lateral size of the labeled spot, which should not be overlarge. The scanning electron microscope (SEM) image of the labeled spot into the resin sample with 0.3 mW of the beam power shows that the lateral dimension is 271 nm and the axial () dimension is 992 nm [Fig. 3(b)].
![]()
Figure 3.Labeled spot 3D feature size. (a) The variance of the lateral (x, y) size of the labeled spot versus the power of the 515 nm fs excitation laser. (b) SEM image of the labeled spot inside the dye resin sample with TPE. The lateral (x, y) size is 271 nm, and the axial (z) size is 992 nm.
For the second step, it is obligatory to carry out lateral coarse pre-alignment to move the inhibition beam to the position of the 515 nm excitation beam, as shown in Fig. 4(a). Once the two beams are adjusted to enter the image view of the camera in parallel, their relative initial position deviates slightly [Fig. 4(a-1)]. It should be mentioned that the 515 nm fs excitation laser and the 405 nm CW laser are blocked by the dichroic mirror in Fig. 1(a). The small green spot (excited by the 515 nm fs laser) and large red spot (excited by the 405 nm CW laser) in Fig. 4(a-1) are the emitted fluorescence light of the AIE dye resin sample with TPE imaged by the camera on the top side of Fig. 1(a). The 515 nm fs laser has a relatively small intensity in order to generate a small-sized recorded spot, which enhances the adjustment resolution. Thus, the green emission spot is relatively small, which is the fluorescence emission of the recorded spot excited by the 515 nm laser. Then, the position of the 405 nm CW laser beam is adjusted to approach the labeled spot gradually [Fig. 4(a-2)] and to move forward further away from the labeled spot [Fig. 4(a-3)]. The alteration in fluorescence intensity at various positions validates that the closer the inhibition beam is to the center of the labeled spot, the stronger the detected fluorescence intensity is [Fig. 4(b)]. The process of coarse pre-alignment of two beams (solid beams) in the lateral direction is achieved by spectrometer dynamic observation, reducing the drift error caused by delayed imaging of raster scanning in other conventional methods. Both directions of the relative displacement and the relative displacement are required to be adjusted to ensure the spatial coincidence of the two beams in three dimensions. The adjustment in the lateral direction is the first step before the fluorescence observation of the labeled spot for the coincidence adjustment process in the next direction of the relative displacement.
![]()
Figure 4.Variation of emission spectral intensity during the coarse pre-alignment process. (a) CCD real-time observation results of relative positions of two beams. (b) The change of fluorescence emission intensity with different relative positions of two beams.
The fine alignment of the two beams with ultra-high accuracy for conventional methods is usually based on raster scanning in the 3D space. However, it will certainly be most challenging without raster scanning. We provide an effective method to solve the above problems, as shown in Fig. 5, by slightly moving the position of the 405 nm CW laser beam to detect the fluorescence intensity change of the labeled spots. The fluorescence intensity is 583 (with the arbitrary unit) at the peak when the initial lateral distance between the two beams is . The fluorescence intensity increases to 675 as decreases to 5 nm. While the inhibition 405 nm CW laser beam moves forward, the fluorescence intensity decreases with and the intensity of 586. The scale values shown in Figs. 5(b) and 5(d) are the value of the staff gauge of the movement stage for controlling the position of the beams. The division of the difference between the maximum and the minimum () and the corresponding difference of the scale values () is 11 nm/0.01 mm for a minimum cell of the scale values (0.01 mm). Thus, a resolution of 22 nm for spatial matching of two beams along the lateral direction of relative displacement is achieved, which is limited by the sensitivity of the spectrometer. Similarly, we also calculate the matching resolution along the axial () direction. The maximum intensity at the peak is 766 when . The division of the difference between the maximum and the minimum () and the corresponding difference of the scale values () is 1 nm/0.01 mm. Thus, a resolution of 27 nm for spatial matching of two beams along the direction of relative displacement is achieved.
![]()
Figure 5.Measurement process of alignment resolution. Fluorescence emission intensity variance versus different relative positions of the two beams along (a) the lateral direction of x/y relative displacement and (c) the axial direction of the z relative displacement. (b), (d) Scale value of the staff gauge on the stage for controlling the movement of the beam and the corresponding physical displacement between the two beams Δx/Δz.
Normally, after the direction of relative displacement coincidence adjustment, it will induce a slight mismatch of the lateral coincidence of the two beams. Thus, the lateral alignment should follow the direction () alignment iteratively until the fluorescence intensity approaches a maximum value. Once the coincidence process is finished, we then add the vortex phase plate in the optical setup to form a doughnut shape for the inhibition beam. When the excitation beam is entirely filled inside the hollow part of the inhibition beam, the 3D coincidence of the two beams is completed.
3. Conclusion
This study demonstrates a dual-beam alignment method for STED characterized by using the AIE dye resin sample with TPE. Contrasted with conventional methods, it just requires forming a labeled spot with the 3D position information and adjusting the inhibition beam to match the excitation beam, resulting in the fast accomplishment of the adjustment. The fluorescence light intensity from the resin sample excited by the two beams contains the coincidence status of their lateral and axial positions. Resolutions of 22 nm along the lateral direction of relative displacement and 27 nm along the direction of relative displacement for spatial matching of two beams are achieved. Furthermore, following this strategy, many other kinds of AIE dyes covering a wide range of wavelengths can be used to fabricate the resin sample, which will be suitable for dual-beam adjustment of most STED microscopies. Except for STED microscopies, this method will be further applied in other types of microscopies or scenarios, which require the spatial matching of three or more laser beams, and the fields of view of different objectives with ultra-high precision.
References
[1] S. W. Hell, J. Wichmann. Breaking the diffraction resolution limit by stimulated emission: stimulated-emission-depletion fluorescence microscopy. Opt. Lett, 19, 780(1994).
[2] T. A. Klar, S. Jakobs, M. Dyba, A. Egner, S. W. Hell. Fluorescence microscopy with diffraction resolution barrier broken by stimulated emission. Proc. Natl. Acad. Sci. U.S.A., 97, 8206(2000).
[3] V. Westphal, S. W. Hell. Nanoscale resolution in the focal plane of an optical microscope. Phys. Rev. Lett., 94, 143903(2005).
[4] G. Donnert, J. Keller, R. Medda, M. A. Andrei, S. O. Rizzoli, R. Lührmann, R. Jahn, C. Eggeling, S. W. Hell. Macromolecular-scale resolution in biological fluorescence microscopy. Proc. Natl. Acad. Sci. U.S.A., 103, 11440(2006).
[5] S. W. Hell. Far-field optical nanoscopy. Science, 316, 1153(2007).
[6] B. Harke, J. Keller, C. K. Ullal, V. Westphal, A. Schönle, S. W. Hell. Resolution scaling in STED microscopy. Opt. Express, 16, 4154(2008).
[7] D. Wildanger, E. Rittweger, L. Kastrup, S. W. Hell. STED microscopy with a supercontinuum laser source. Opt. Express, 16, 9614(2008).
[8] D. Wildanger, R. Medda, L. Kastrup, S. W. Hell. A compact STED microscope providing 3D nanoscale resolution. J. Microsc., 236, 35(2009).
[9] J. Fischer, M. Wegener. Three-dimensional optical laser lithography beyond the diffraction limit. Laser Photonics Rev., 7, 22(2013).
[10] J. Fischer, M. Wegener. Ultrafast polymerization inhibition by stimulated emission depletion for three-dimensional nanolithography. Adv. Mater., 24, OP65(2012).
[11] T. J. A. Wolf, J. Fischer, M. Wegener, A.-N. Unterreiner. Pump-probe spectroscopy on photoinitiators for stimulated-emission-depletion optical lithography. Opt. Lett., 36, 3188(2011).
[12] Z. Gan, Y. Cao, R. A. Evans, M. Gu. Three-dimensional deep sub-diffraction optical beam lithography with 9 nm feature size. Nat. Commun., 4, 2061(2013).
[13] T. Grotjohann, I. Testa, M. Leutenegger, H. Bock, N. T. Urban, F. Lavoie-Cardinal, K. I. Willig, C. Eggeling, S. Jakobs, S. W. Hell. Diffraction-unlimited all-optical imaging and writing with a photochromic GFP. Nature, 478, 204(2011).
[14] X. Li, Y. Cao, N. Tian, L. Fu, M. Gu. Multifocal optical nanoscopy for big data recording at 30 TB capacity and gigabits/second data rate. Optica, 2, 567(2015).
[15] S. Lamon, Y. Wu, Q. Zhang, X. Liu, M. Gu. Nanoscale optical writing through upconversion resonance energy transfer. Sci. Adv., 7, eabe2209(2021).
[16] J. B. Ding, K. T. Takasaki, B. L. Sabatini. Supraresolution imaging in brain slices using stimulated-emission depletion two-photon laser scanning microscopy. Neuron, 63, 429(2009).
[17] N. T. Urban, K. I. Willig, S. W. Hell, U. V. Nägerl. STED nanoscopy of actin dynamics in synapses deep inside living brain slices. Biophys. J., 101, 1277(2011).
[18] B. R. Rankin, G. Moneron, C. A. Wurm, J. C. Nelson, A. Walter, D. Schwarzer, J. Schroeder, D. A. Colón-Ramos, S. W. Hell. Nanoscopy in a living multicellular organism expressing GFP. Biophys. J., 100, L63(2011).
[19] S. Berning, K. I. Willig, H. Steffens, P. Dibaj, S. W. Hell. Nanoscopy in a living mouse brain. Science, 335, 551(2012).
[20] T. J. Gould, D. Burke, J. Bewersdorf, M. J. Booth. Adaptive optics enables 3D STED microscopy in aberrating specimens. Opt. Express, 20, 20998(2012).
[21] Y. Wang, C. Kuang, S. Li, X. Hao, Y. Xu, X. Liu. A 3D aligning method for stimulated emission depletion microscopy using fluorescence lifetime distribution. Microsc. Res. Tech., 77, 935(2014).
[22] D. Wildanger, J. Bückers, V. Westphal, S. W. Hell, L. Kastrup. A STED microscope aligned by design. Opt. Express, 17, 16100(2009).
[23] X. Yuan, M. Zhao, Z. Gan, H. Ruan. Fluorescence method of two beams 3D superposition based on confocal technology. Optik, 205, 163425(2020).
[24] J. Luo, Z. Xie, J. W. Y. Lam, L. Cheng, B. Z. Tang, H. Chen, C. Qiu, H. S. Kwok, X. Zhan, Y. Liu, D. Zhu. Aggregation-induced emission of 1-methyl-1,2,3,4,5-pentaphenylsilole. Chem. Commun., 18, 1740(2001).
[25] Y. Du, H. Liu. Silsesquioxane-based hexaphenylsilole-linked hybrid porous polymer as an effective fluorescent chemosensor for metal ions. ChemistrySelect, 3, 1667(2018).
[26] R. Hu, N. Leung, B. Tang. AIE macromolecules: syntheses, structures and functionalities. Chem. Soc. Rev., 43, 4494(2014).
[27] J. He, B. Xu, F. Chen, H. Xia, K. Li, L. Ye, W. Tian. Aggregation-induced emission in the crystals of 9,10-distyrylanthracene derivatives: the essential role of restricted intramolecular torsion. J. Phys. Chem. C, 113, 9892(2009).
[28] D. Wang, H. Su, R. T. K. Kwok, X. Hu, H. Zou, Q. Luo, M. M. S. Lee, W. Xu, J. W. Y. Lam, B. Z. Tang. Rational design of a water-soluble NIR AIEgen, and its applications for ultrafast wash-free cellular imaging and photodynamic cancer cell ablation. Chem. Sci., 9, 3685(2018).

Set citation alerts for the article
Please enter your email address
© Copyright 2018-2021 | Chinese Laser Press. All Rights Reserved 沪ICP备15018463号-20