
Yuebo Meng, Xuanrun Chen, Guanghui Liu, Shengjun Xu. Crowd Density Estimation Method Based on Multi-Feature Information Fusion[J]. Laser & Optoelectronics Progress, 2021, 58(20): 2010021
- Laser & Optoelectronics Progress
- Vol. 58, Issue 20, 2010021 (2021)
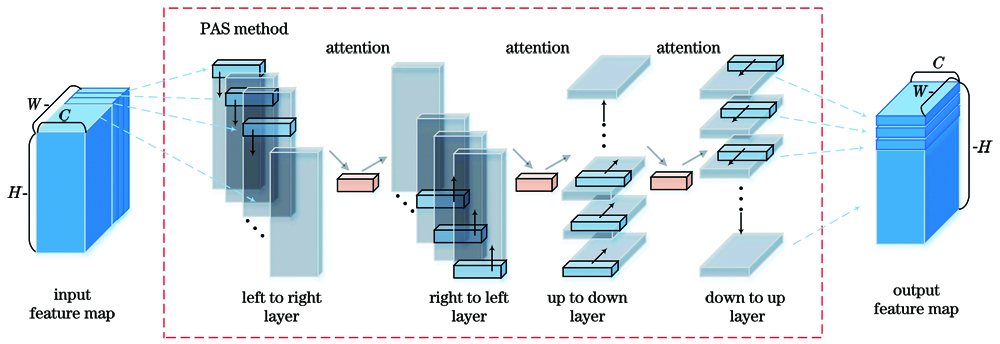
Fig. 1. Perspective structure of spatial attention
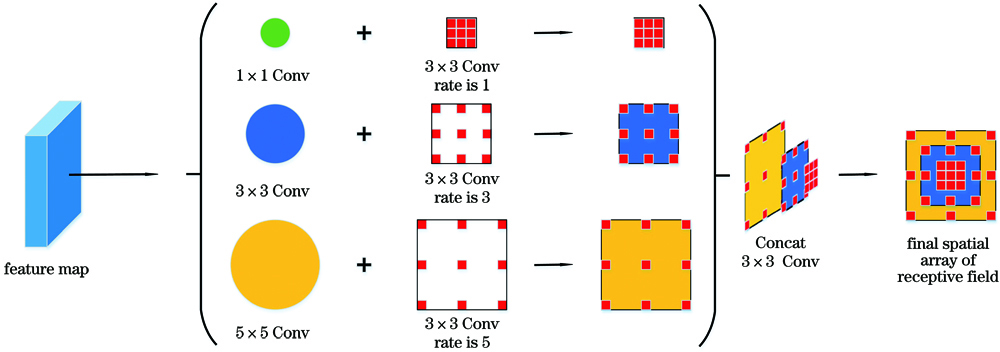
Fig. 2. Multi-scale information aggregation structure
Fig. 3. Asymmetric convolution structure
Fig. 4. Diagram of feature fusion process
Fig. 5. Structural diagram of semantic embedding and feature fusion
Fig. 6. Structural diagram of multi-feature information fusion network
Fig. 7. Flow chart of multi-feature information fusion network algorithm
Fig. 8. Experimental results in ShanghaiTech dataset. (a) Original graphs; (b) true-value graphs; (c) prediction results
Fig. 9. Experimental results in Mall dataset. (a) Original graphs; (b) true-value graphs; (c) prediction results
| ||||||||||||||||||||||||||||||||||||||||||||
Table 1. Performance comparison among algorithms for ShanghaiTech dataset
|
Table 2. Performance comparison among algorithms for Mall dataset
|
Table 3. Performance comparison among algorithms for Worldexpo’10 dataset
| |||||||||||||||||||||||||||||||||||||||||||
Table 4. Comparative analysis of algorithm complexity

Set citation alerts for the article
Please enter your email address
© Copyright 2018-2021 | Chinese Laser Press. All Rights Reserved 沪ICP备15018463号-20