
Xianzhao* LIU. A Comparative Decomposition Analysis of the Factors Driving Energy-related Carbon Emissions from Three Typical Provinces in China: Jiangsu, Henan and Inner Mongolia[J]. Journal of Resources and Ecology, 2020, 11(5): 483
- Journal of Resources and Ecology
- Vol. 11, Issue 5, 483 (2020)
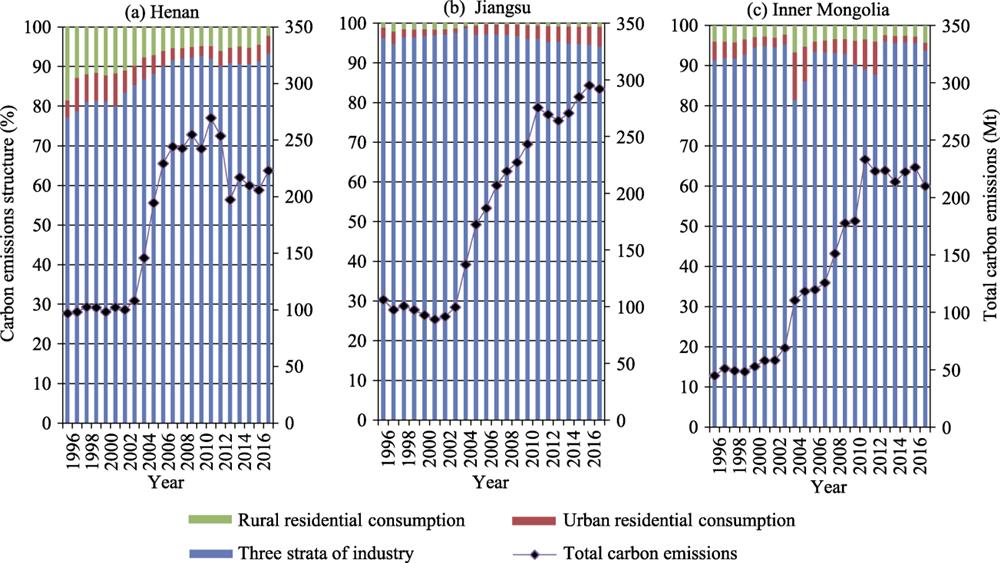
Fig. 1. Fig. 1
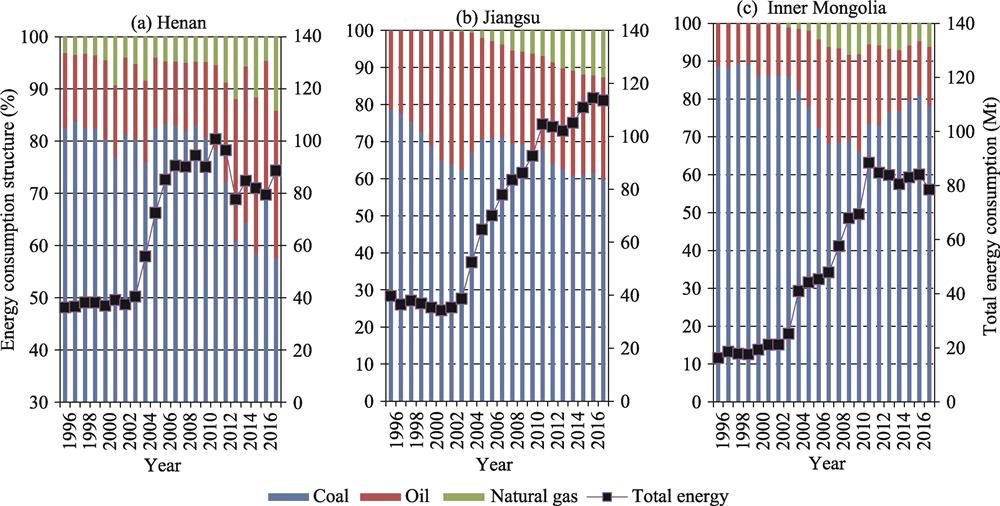
Fig. 2. Fig. 2
Fig. 3. Fig. 3
Fig. 4. Fig. 4
Fig. 5. Fig. 5
Fig. 6. Fig. 6
|
Table 1.
Coefficients of the eight fossil energy resources used in carbon emission calculations
|
Table 2.
Cumulative decomposition results of various factors in the three provinces during 1996-2017 (unit: ×106 t)
|
Table 3.
Statistical indicators related to carbon emissions in the three provinces during the period of 1996-2017 (unit: %)
|
Table 4.
Decomposition results of various factors affecting carbon emissions in the three provinces during different periods (unit: ×106 t)
| |||||||||||||||||||||||||||||||||||||||||||||||||||||||||||||||||||||||||||||||||||||||||||||||||||||||||||||||||||||||||||||||||||||||||||||||||||||||||||||||
Table 5.
Description of statistical indices related to carbon emissions in the three provinces during different periods (unite: %)

Set citation alerts for the article
Please enter your email address
© Copyright 2018-2021 | Chinese Laser Press. All Rights Reserved 沪ICP备15018463号-20