• Photonics Research
  • Vol. 10, Issue 11, 2614 (2022)
Yujie Cai1, Yu Chen1、2、4、*, Xiaoning Xin1, Kun Huang1, and E Wu1、2、3、5、*
Author Affiliations
  • 1State Key Laboratory of Precision Spectroscopy, East China Normal University, Shanghai 200062, China
  • 2Chongqing Key Laboratory of Precision Optics, Chongqing Institute of East China Normal University, Chongqing 401120, China
  • 3Collaborative Innovation Center of Extreme Optics, Shanxi University, Taiyuan 030006, China
  • 4e-mail:
  • 5e-mail:
  • show less
    DOI: 10.1364/PRJ.467695 Cite this Article Set citation alerts
    Yujie Cai, Yu Chen, Xiaoning Xin, Kun Huang, E Wu. Mid-infrared single-photon upconversion spectroscopy based on temporal-spectral quantum correlation[J]. Photonics Research, 2022, 10(11): 2614 Copy Citation Text show less
    Schematic flow diagram of the MIR upconversion quantum spectroscopy based on temporal-spectral correlation. Inset, normalized JSI of the SPDC process pumped by a 1032.88 nm laser with a linewidth of about 2.78 nm in a 25-mm-long MgO-doped CPLN with the poling period from 23.0 μm to 32.0 μm.
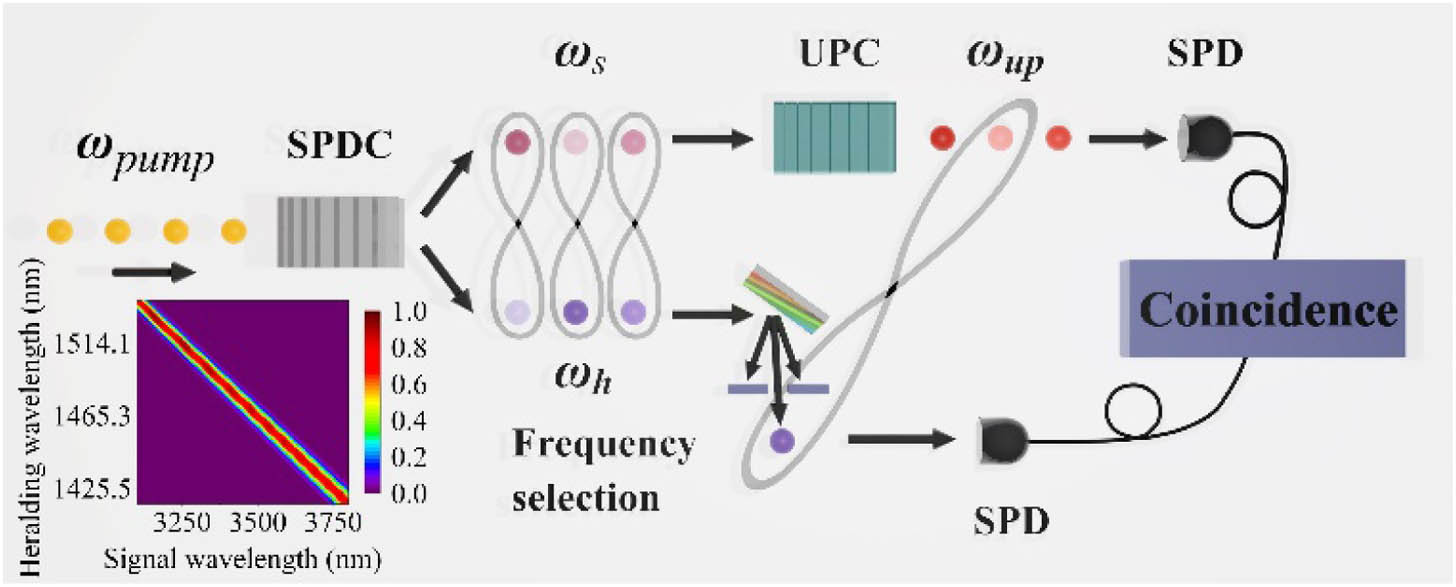
    Fig. 1. Schematic flow diagram of the MIR upconversion quantum spectroscopy based on temporal-spectral correlation. Inset, normalized JSI of the SPDC process pumped by a 1032.88 nm laser with a linewidth of about 2.78 nm in a 25-mm-long MgO-doped CPLN with the poling period from 23.0 μm to 32.0 μm.
    Schematic of the MIR upconversion quantum spectroscopy experimental setup, including the broadband SPDC photon-pair source, the MIR frequency upconversion module (UPC), and the correlation-based spectrum detection module. HWP1−3, half-wave plates; PBS, polarization beam splitter; M1−2, optical mirrors; L1−12, lenses; CPLN1−2, chirp-poled lithium niobite crystals; ODL, optical delay line; DM1−2, dichroic mirrors; Ge, anti-reflection coated germanium window; SFG, sum-frequency generation; SPCM, Si single-photon counting module; SNSPD, superconducting nanowire single-photon detector; TCSPC, time-correlated single-photon counter. The filter before the monochromator is a long-pass 1300 nm filter, and the filter before the SPCM includes a long-pass 750 nm filter, a short-pass 850 nm filter, and a 40 nm bandpass filter at 800 nm.
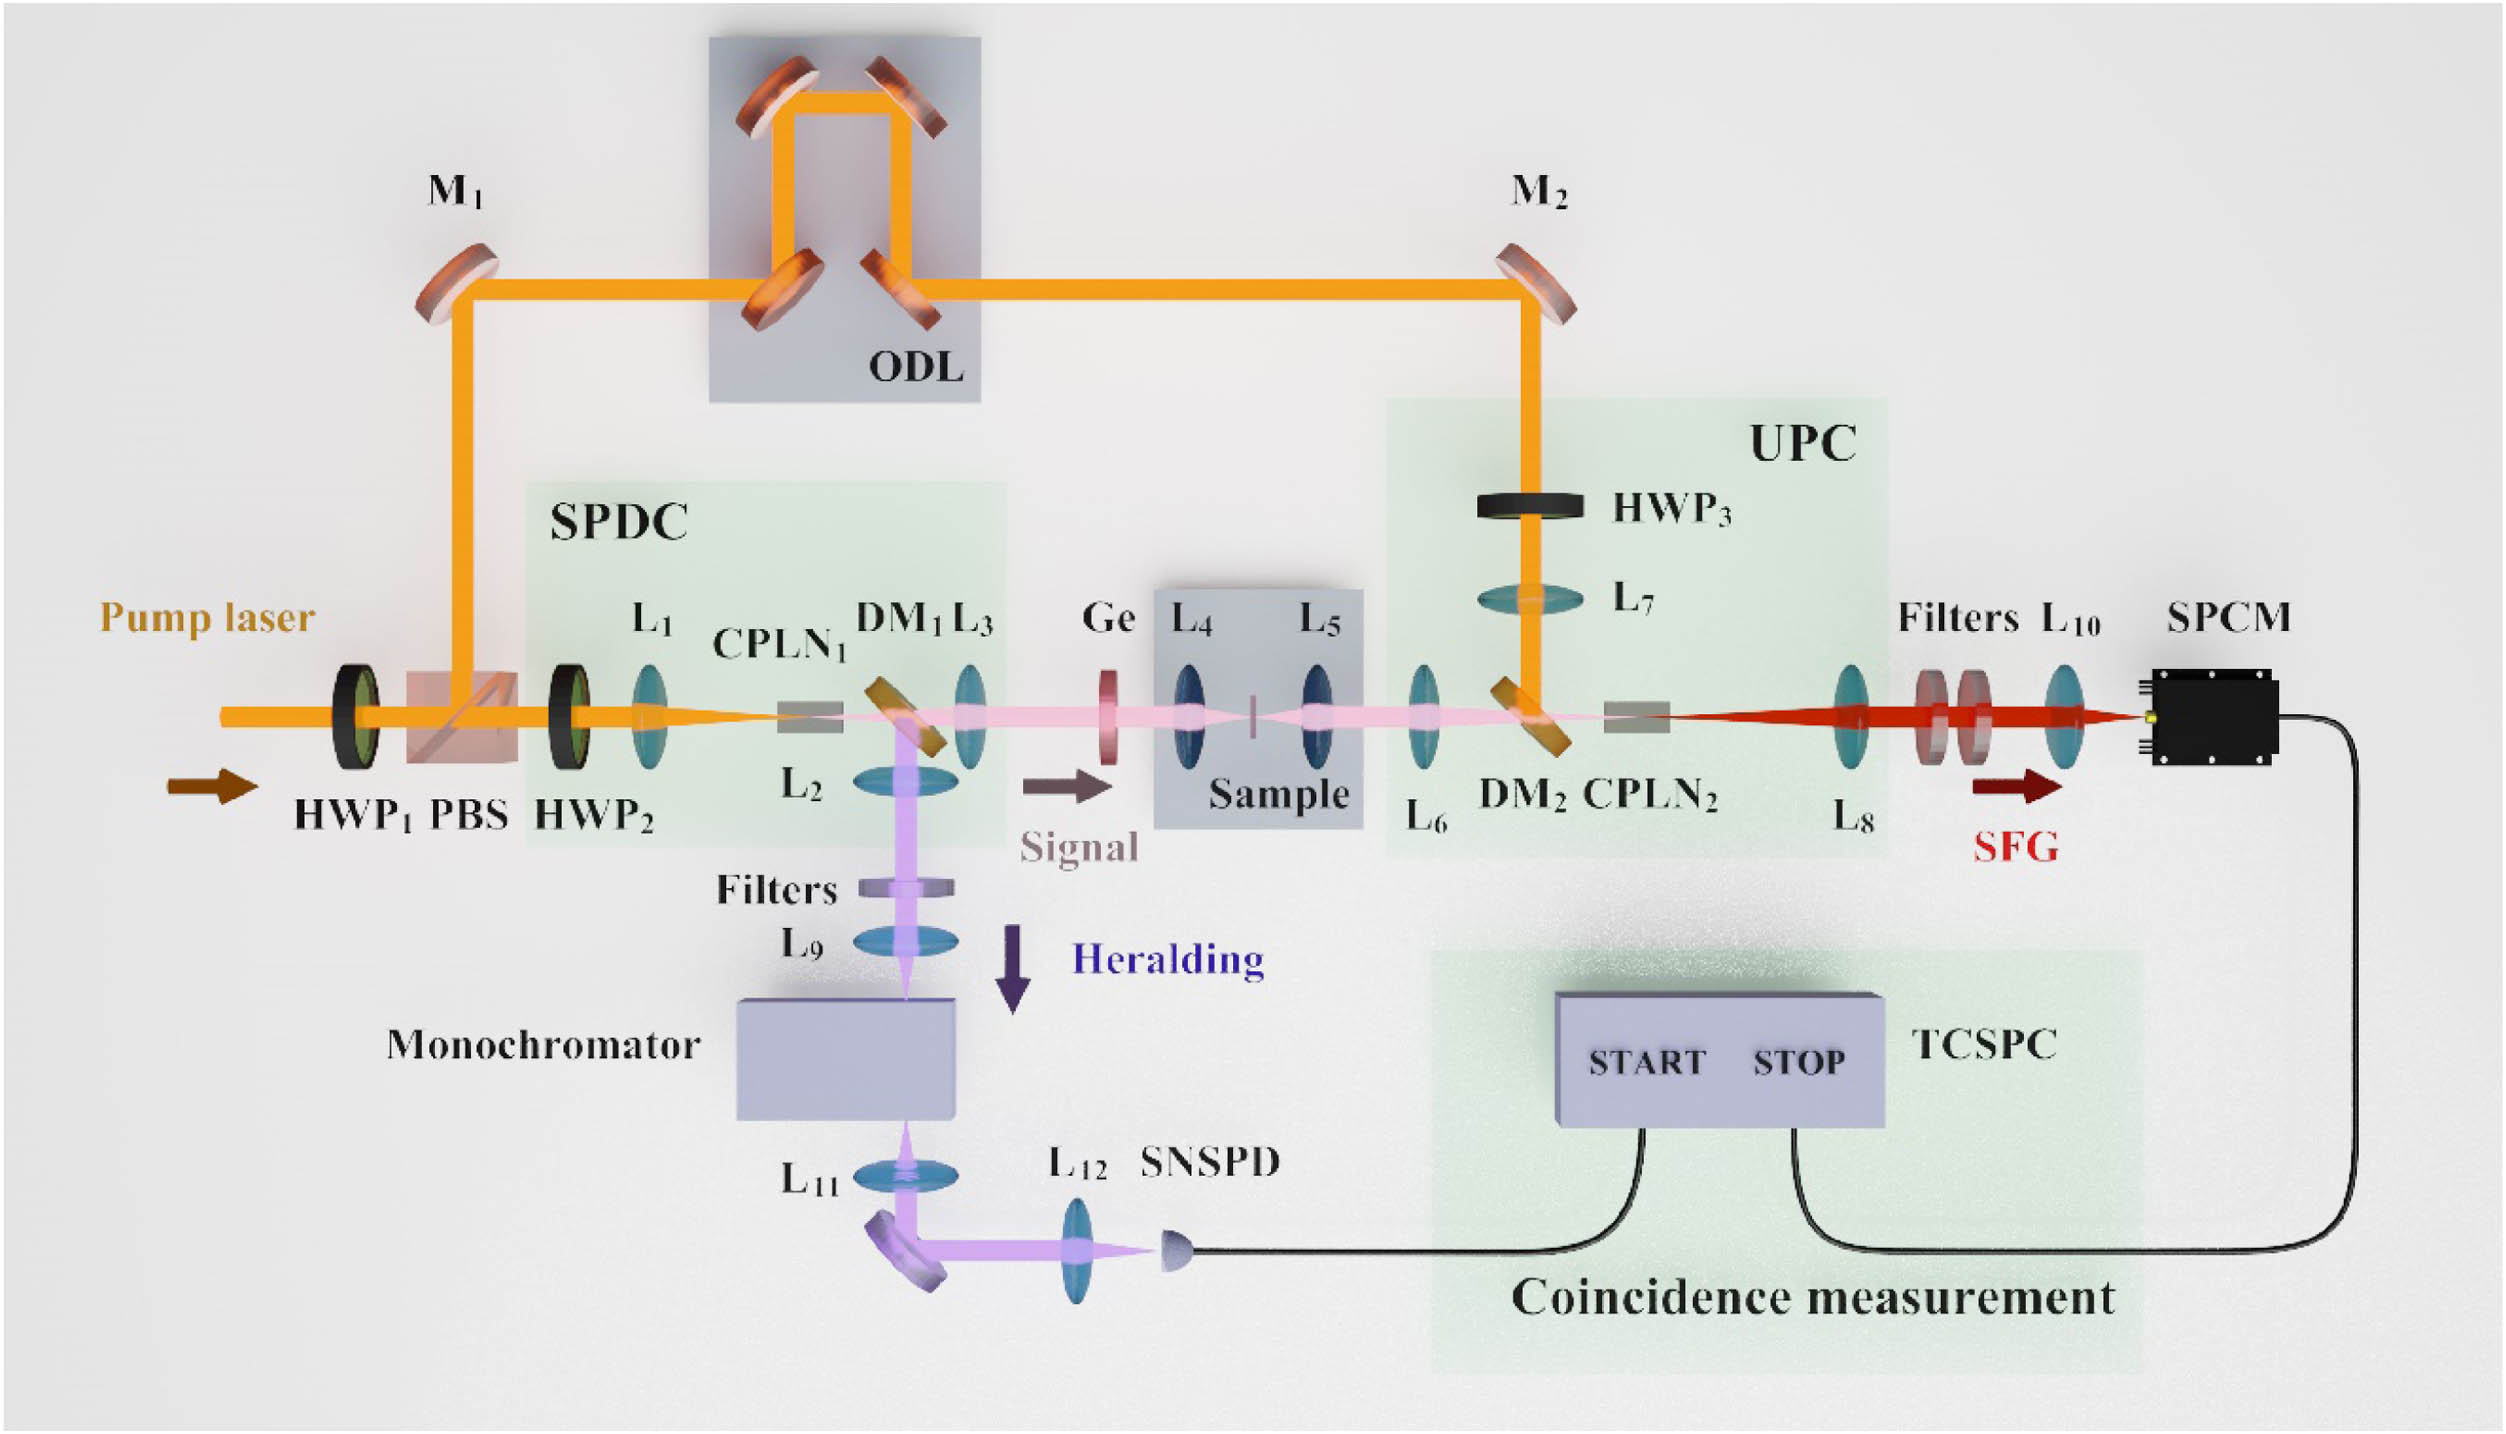
    Fig. 2. Schematic of the MIR upconversion quantum spectroscopy experimental setup, including the broadband SPDC photon-pair source, the MIR frequency upconversion module (UPC), and the correlation-based spectrum detection module. HWP13, half-wave plates; PBS, polarization beam splitter; M12, optical mirrors; L112, lenses; CPLN12, chirp-poled lithium niobite crystals; ODL, optical delay line; DM12, dichroic mirrors; Ge, anti-reflection coated germanium window; SFG, sum-frequency generation; SPCM, Si single-photon counting module; SNSPD, superconducting nanowire single-photon detector; TCSPC, time-correlated single-photon counter. The filter before the monochromator is a long-pass 1300 nm filter, and the filter before the SPCM includes a long-pass 750 nm filter, a short-pass 850 nm filter, and a 40 nm bandpass filter at 800 nm.
    Spectra of NIR heralding photons via a monochromator together with the SNSPD (cyan circles) and upconverted signal photons via a spectrograph with an exposure time of 90 s (purple line) when pump power for SPDC is 5 mW.
    Fig. 3. Spectra of NIR heralding photons via a monochromator together with the SNSPD (cyan circles) and upconverted signal photons via a spectrograph with an exposure time of 90 s (purple line) when pump power for SPDC is 5 mW.
    Coincidence counting rate (black squares) and CAR value (red circles) as a function of pump power for SPDC. Solid curves represent a fit to the experimental data. Inset, typical coincidence histogram at the pump power for CPLN1 of 0.4 mW recorded by TCSPC with a time window of 5.12 ns with (black) and without (orange) the MIR incident photon.
    Fig. 4. Coincidence counting rate (black squares) and CAR value (red circles) as a function of pump power for SPDC. Solid curves represent a fit to the experimental data. Inset, typical coincidence histogram at the pump power for CPLN1 of 0.4 mW recorded by TCSPC with a time window of 5.12 ns with (black) and without (orange) the MIR incident photon.
    Coincidence spectrum by scanning the wavelength of the heralding photon. The shaded error band represents the standard deviation obtained from several independent measurements with an acquisition time of 90 s for each. Inset, time correlation histogram of photon pairs at the heralding photon wavelength of 1503.45 nm.
    Fig. 5. Coincidence spectrum by scanning the wavelength of the heralding photon. The shaded error band represents the standard deviation obtained from several independent measurements with an acquisition time of 90 s for each. Inset, time correlation histogram of photon pairs at the heralding photon wavelength of 1503.45 nm.
    Transmission spectra of PS film with thickness of 38 μm. Dots represent the spectrum measured via the MIR upconversion spectroscopy system based on temporal-spectral quantum correlation. Solid line represents the spectrum measured via a commercial FTIR spectrometer as a comparison. The shaded error bands represent the accuracy of the transmittance spectrum obtained by the coincidence detection.
    Fig. 6. Transmission spectra of PS film with thickness of 38 μm. Dots represent the spectrum measured via the MIR upconversion spectroscopy system based on temporal-spectral quantum correlation. Solid line represents the spectrum measured via a commercial FTIR spectrometer as a comparison. The shaded error bands represent the accuracy of the transmittance spectrum obtained by the coincidence detection.
    Measured photon number of heralding photons Nh (red triangles), upconverted MIR signal photons Nup (green squares), and measured coincidence counting rate Ncoin,net (blue circles) as a function of pump intensity for SPDC. Corresponding lines are the results of linear fitting, respectively.
    Fig. 7. Measured photon number of heralding photons Nh (red triangles), upconverted MIR signal photons Nup (green squares), and measured coincidence counting rate Ncoin,net (blue circles) as a function of pump intensity for SPDC. Corresponding lines are the results of linear fitting, respectively.
    Transmission spectra of plastic samples, including (a) 50 μm PS film, (b) PE cling film, and (c) 18.6 μm PMMA film that are measured by using the commercial FTIR spectrometer (lines) or MIR upconversion spectroscopy system based on the temporal-spectral quantum correlation (scatters). The shaded error bands represent the accuracy of the transmission spectrum obtained by the coincidence detection.
    Fig. 8. Transmission spectra of plastic samples, including (a) 50 μm PS film, (b) PE cling film, and (c) 18.6 μm PMMA film that are measured by using the commercial FTIR spectrometer (lines) or MIR upconversion spectroscopy system based on the temporal-spectral quantum correlation (scatters). The shaded error bands represent the accuracy of the transmission spectrum obtained by the coincidence detection.
    Yujie Cai, Yu Chen, Xiaoning Xin, Kun Huang, E Wu. Mid-infrared single-photon upconversion spectroscopy based on temporal-spectral quantum correlation[J]. Photonics Research, 2022, 10(11): 2614
    Download Citation