
Yujie Cai, Yu Chen, Xiaoning Xin, Kun Huang, E Wu. Mid-infrared single-photon upconversion spectroscopy based on temporal-spectral quantum correlation[J]. Photonics Research, 2022, 10(11): 2614
- Photonics Research
- Vol. 10, Issue 11, 2614 (2022)
Abstract
1. INTRODUCTION
High-sensitivity infrared spectroscopy is particularly essential to assess the structure of complex substances and gather molecular characteristic information. Strong characteristic rotational-vibrational transitions of a large number of molecules lie within the mid-infrared (MIR) spectral range from 2.5 μm to 25 μm. Currently, attainable applications of MIR spectroscopy include biochemical sensing [1,2], material study [3], gas detection [4], and environmental monitoring [5]. Spectroscopy in the THz and far-infrared range has particular potential for research of biological tissues [6–9]. Conventionally, the standard measurement technique of MIR spectroscopy is the Fourier transform infrared (FTIR) spectrometer [10]. But FTIR spectroscopy is restrictive due to the performance of MIR detection components. Unlike detectors operated in the visible and near-infrared (NIR) regime, MIR detectors are often influenced by the intrinsic blackbody radiation and dark current noise, as well as stray noise in the environment. MIR detectors, both sophisticated semiconductors devices based on mercury cadmium telluride or indium antimonide and energy sensors such as thermopile or pyroelectric detectors, remain a major obstacle of FTIR system in high-sensitivity and low-noise spectral measurements. Though the environmental noise can be ignored by increasing the illumination light intensity, damage to the photosensitive samples is unavoidable when the light intensity is high, especially for the biochemical photosensitive specimens’ measurement such as real-time tracking of sucrose hydrolysis and the study of glycated catalase fluoroscopy [11,12].
Recent researches, including nonlinear interferometric spectroscopy [13–15], dual-optical comb spectroscopy [16–18], and frequency upconversion spectroscopy [19–22], aim to go beyond the constraints of traditional MIR spectroscopy techniques. Among these methods, MIR spectroscopy based on frequency upconversion is quite promising. The MIR spectral information is converted to the visible or NIR regime with a strong pump laser field in a nonlinear medium. Therefore, high-efficiency, low-noise, and economical photodetection devices in the visible and NIR region such as silicon (Si) single-photon detectors can be utilized for upconversion-based spectroscopy. The chirp-poling (CPLN) waveguide and bulk crystal have been demonstrated to achieve relatively uniform broadband spectral response for MIR spectral analysis with high precision, high stability [23], and high signal-to-noise ratio (SNR) [24]. In such a frequency upconversion process, a strong pumping field is usually required to achieve a high conversion efficiency. But strong pumping field will also lead to strong parasitic noise in nonlinear media, including upconverted spontaneous parametric downconversion (SPDC), spontaneous Raman scattering and thermal radiation, and the background pedestal formed by random duty-cycle errors in the fabrication of the quasi-phase-matching (QPM) gratings. Previously, a long-wavelength-pumping scheme has been recommended to remarkably reduce the parasitic noise and, as such, has realized highly sensitive NIR photon detection and imaging [25,26]. However, when MIR frequency upconversion is concerned, the long-wavelength-pumping scheme is not applicable. Usually, the pumping wavelength for the MIR frequency upconversion is chosen at around 1 μm so that the wavelength of the upconverted photons can fall into the spectral response range of Si detectors [27,28]. But with such a short-wavelength-pumping scheme, strong parasitic noise appears at the wavelength coinciding with MIR signal photons and is subsequently upconverted together with the signal photons to the same wavelength, making it unfeasible to separate and eliminate. In addition, narrow-linewidth spectral filtering cannot be employed in the broadband frequency upconversion, making parasitic noise more difficult to be removed. Driven by the challenges inherent to MIR detection in the complex environment and demands of non-destructive MIR spectral analysis for biochemical samples and reactions, high MIR spectral detection sensitivity is pursued in case of weak illumination.
In this work, we propose and demonstrate a scheme of broadband MIR single-photon frequency upconversion spectroscopy based on temporal-spectral quantum correlation. Broadband MIR signal photons from non-degenerate SPDC photon pairs are frequency upconverted for detection via the synchronous frequency upconversion technique where the temporal-spectral quantum correlation of MIR photons is well retained. Thanks to the temporal-spectral quantum correlation, MIR signal information can be extracted effectively from the strong noise caused by the pump laser by the coincidence measurement of the heralding photon and the upconverted signal photon. An MIR correlation spectrum is accomplished at an incident MIR photon flux as low as 0.09 average photons per pulse over a wide range of about 660 nm in the MIR regime, providing a reliable and practical solution for MIR single-photon spectroscopy. Our scheme opens up a new avenue for ultra-sensitive and robust MIR spectroscopy at the single-photon level for applications in biological and material science research.
Sign up for Photonics Research TOC. Get the latest issue of Photonics Research delivered right to you!Sign up now
2. PRINCIPLE
MIR spectroscopy measurement could be realized by the broadband frequency upconversion technique based on sum-frequency generation (SFG) that transfers the MIR photons to the NIR or visible wavelength range. A highly efficient frequency upconversion process can be achieved by using periodically poled nonlinear crystals based on QPM,
One method of capturing information in the presence of strong noise is to use correlated photon pairs as the light source owing to the temporal quantum correlation [29–31]. Meanwhile, the spectral quantum correlation of the photon pairs provides a solution for spectral measurement [32]. Here, we take full advantage of the temporal-spectral correlation of the photon pairs and frequency upconversion to perform the ultra-sensitive MIR spectroscopy under noisy conditions. Figure 1 illustrates the process of the MIR upconversion quantum spectroscopy scheme. The correlated photon pairs are generated via an SPDC process. One pump photon passing through the nonlinear crystal is split into a heralding photon with and a signal photon with . The signal photon can be generated in the MIR band around 3–4 μm and the pairwise in the NIR band around 1.4–1.5 μm with a pumping wavelength at about 1.03 μm. The SPDC photon pairs overlap in temporal modes and are frequency anti-correlated in spectral modes.
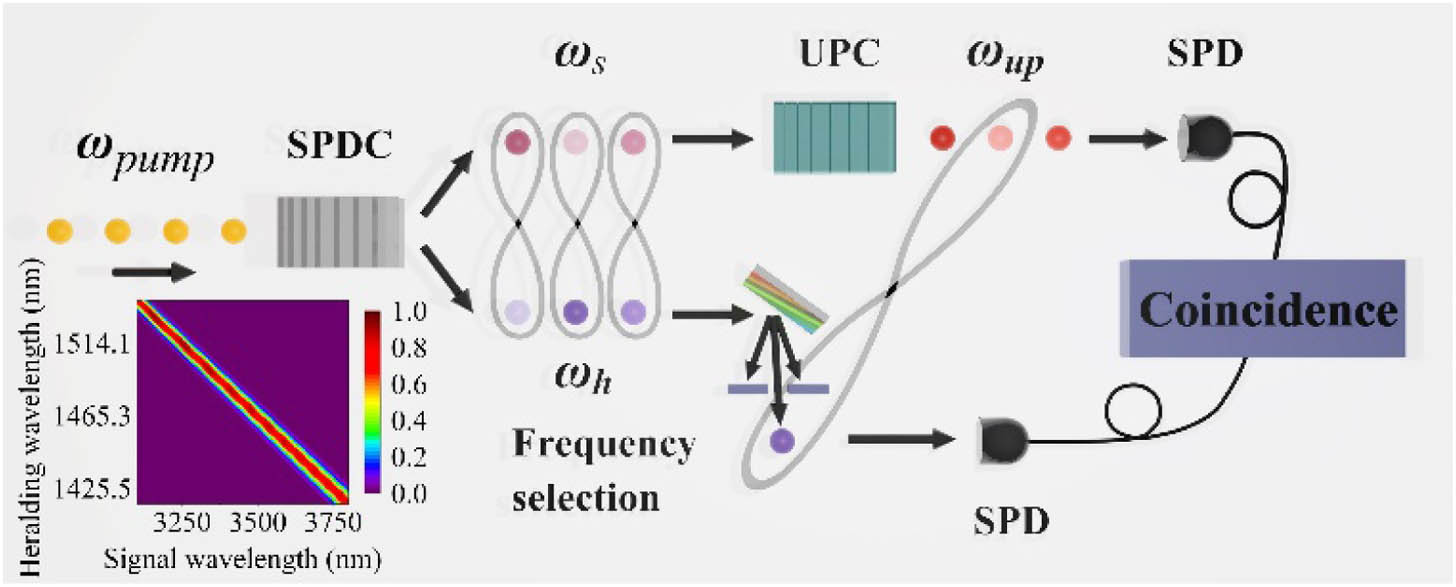
Figure 1.Schematic flow diagram of the MIR upconversion quantum spectroscopy based on temporal-spectral correlation. Inset, normalized JSI of the SPDC process pumped by a 1032.88 nm laser with a linewidth of about 2.78 nm in a 25-mm-long MgO-doped CPLN with the poling period from 23.0 μm to 32.0 μm.
The state of photon pairs generated by SPDC can be determined by
Under the conditions of phase matching, lossless medium, and undepleted large amplitude of the pump mode, the coupled-mode equations of the upconversion light field can be solved as [34]
The quantum correlation of the MIR photon with its pairwise photon is inherited by the upconverted photon . The quantum correlation of SPDC photon pairs is retained in the frequency upconversion process [35].
Therefore, the coincidence of the heralding photon and the upconverted signal photon is registered to reproduce the MIR spectrum. In a “non-local” manner, non-degenerate photon pairs give a unique advantage in that when one of the twin photons is at a spectral frequency difficult to investigate, it is still capable of detecting MIR spectral information by analyzing its NIR partner.
3. EXPERIMENTAL SECTION
The schematic configuration of the MIR single-photon frequency upconversion spectroscopy system is depicted in Fig. 2, which includes the broadband MIR-NIR photon-pair source, the MIR frequency upconversion module, and the correlation-based spectrum detection module. A mode-locked pulsed Yb-fiber laser together with an amplifier is used to generate the broadband correlated photon pairs via the SPDC process in a nonlinear crystal and also as the pumping source to drive the synchronous frequency upconversion process for MIR signal photons in . The pump laser source is operated at a stable repetition rate of 30 MHz with a pulse duration of 6 ps. The output wavelength is at 1032.88 nm with a linewidth of about 2.78 nm. The maximum average output power is about 330 mW. The pump laser is split into two parts with a half-wave plate and a polarization beam splitter (PBS). A small portion of the pump laser is used to generate the SPDC photon pairs, and most of the pump laser is set for the MIR upconversion.
![]()
Figure 2.Schematic of the MIR upconversion quantum spectroscopy experimental setup, including the broadband SPDC photon-pair source, the MIR frequency upconversion module (UPC), and the correlation-based spectrum detection module.
For the SPDC process, a 25-mm-long MgO-doped bulk crystal is designed with chirped poling period from 23.0 μm to 32.0 μm, which theoretically ensures that, when pumped at 1032.88 nm, the phase matching of the MIR signal wavelength ranges from 2.5 μm to 5 μm while the heralding wavelength ranges from 1760.05 nm to 1301.80 nm. The MIR signal photons and NIR heralding photons are separated by a dichroic mirror ().
The MIR signal photon passes through a germanium (Ge) window to be extracted from the residual pump and the heralding photon, and then it is converted to be around 800 nm by deploying an efficient synchronous pumping upconversion scheme. The pump power of SFG is about 320 mW on , corresponding to a peak power of 1.78 kW. The pump pulse and the MIR signal photon temporally coincide and collinearly interact inside , which is a bulk crystal with chirped poling period from 20.60 μm to 22.85 μm operating at 40°C. The delay is adjusted by an optical delay line (ODL) in the pump laser beam. According to the trade-off between the conversion efficiency and the bandwidth of the spectrum, the focal length of lenses is selected with , because weak focusing increases Rayleigh length and the QPM bandwidth, albeit with a reduction in conversion efficiency [36]. All the upconverted photons carrying MIR information are collected and filtered by a 40 nm bandpass filter at 800 nm before being detected by a Si single-photon counting module (Excelitas, SPCM-780-14). Meanwhile, the NIR heralding photons are filtered by a long-pass filter cutting off at 1300 nm, sent to the monochromator (Andor, SR-500i-B1-R-SIL) for wavelength selection, and then detected by a superconducting nanowire single-photon detector (SNSPD). The coincidence is recorded by a time-correlated single-photon counter (TCSPC, PicoQuant HydraHarp 400).
4. RESULTS AND DISCUSSION
A. Characterization of the Correlated Photon Pairs
First, the correlated photon pairs are characterized. At the pump power for SPDC of about 5 mW, the spectrum of the NIR heralding photons is measured independently by a monochromator together with the SNSPD, showing uniform spectral coverage of greater than 130 nm from 1418.42 nm to 1548.98 nm by the cyan circles in Fig. 3, indicating that the generated MIR signal photons cover the wavelength range at least from 3100 nm to 3800 nm.
![]()
Figure 3.Spectra of NIR heralding photons via a monochromator together with the SNSPD (cyan circles) and upconverted signal photons via a spectrograph with an exposure time of 90 s (purple line) when pump power for SPDC is 5 mW.
Subsequently, thanks to the synchronous single-pass upconversion scheme with , the broadband MIR spectral information from 3140–3800 nm is transferred to 777.22–812.13 nm. And the SFG spectrum is captured by a spectrograph when the MIR photon flux is about 1.13 average photons per pulse as shown by the purple line in Fig. 3. According to the phase-matching function of SPDC, the spectrum is in good agreement with the prediction of the NIR heralding photons. This part can also be used individually as the conventional MIR frequency upconversion spectrum system. But the SNR is much decreased with the reduction of the MIR signal photon flux. When the MIR photon flux is further reduced to less than one photon per pulse, the system noise completely drowns out the MIR spectral signal, which fails the MIR spectral measurement.
Then, all the heralding NIR photons are guided to the SNSPD, and all the upconverted signal photons are collected and detected by the SPCM. Since the upconverted thermal radiation and parametric fluorescence noise caused by the intensive pump laser mainly occur at the same wavelength as MIR signal photons, the upconverted photons are totally buried in the large noise. It is impossible to identify the upconverted signal photons by simply judging from the photon counting rate. Fortunately, in the coincidence measurement only the time-correlated photon pair from SPDC contributes to the main peak, and the uncorrelated noise photons can be ignored, providing an effective way to extract the signal photons from the ocean of noise photons. As shown in the inset of Fig. 4, the clear coincidence peak is observed at zero-time delay, confirming the temporal quantum correlation of the MIR photon with its pairwise photon is well inherited by the upconverted photon. The coincidence-to-accidental ratio (CAR) and the coincidence counting rate are the main figures-of-merit to be considered in the correlation spectral measurement, as shown in Fig. 4. The CAR is fitted by , where and are dark counts of the SNSPD and the SPCM, respectively. is the number of SPDC events, which is proportional to the pump power. and are the overall detection efficiency of NIR heralding photons and MIR signal photons, respectively [37]. As the pump power on increases, the coincidence counting rate increases, but the probability of multi-photon events from the photon-pair source also increases, resulting in a lower CAR. If the pump power on is too weak, the low coincidence counting rate (black squares) will lead to considerable uncertainty of coincidence measurement. Taking the trade-off between CAR and its uncertainty into consideration, the pump power used for SPDC photon-pair generation is tuned to 0.4 mW. The counting rate of NIR heralding photons from SPDC photon pair detected by SNSPD is about in total with a noise rate of less than . The counting rate of SPCM is . There is no difference in the SPCM counting rate when blocking the MIR signal beam, indicating that the signal photons are totally buried in the noise. But the coincidence peak could still achieve great robustness against such undesired noise caused by the SFG process with a background corrected CAR value of 16.7, ensuring coincidence (black column) recognition among additional noise (orange column) induced by the strong pump power in . The accidental coincidence peaks here represent the noise of the MIR quantum spectroscopy system, which is mainly for several parts. First, there are uncorrelated photons from multi-pair generation events that are, thus, superimposed into the accidental events. Second, pump-induced nonlinear noise from the upconversion process would still be an additional noise to be introduced into the accidental events. The flux of the MIR photons incidence on the sample could be as low as 0.09 average photons per pulse, corresponding to (see Fig. 7 in the Appendix A). In such low-light and noisy conditions, high-sensitivity spectral measurement can still be achieved thanks to the temporal quantum correlation between photon pairs.
![]()
Figure 4.Coincidence counting rate (black squares) and CAR value (red circles) as a function of pump power for SPDC. Solid curves represent a fit to the experimental data. Inset, typical coincidence histogram at the pump power for
Then, the monochromator is inserted in the heralding NIR photon detection part for the spectral quantum correlation characterization. Once a photon traveling through the NIR monochromator is detected by the SNSPD and its MIR pairwise is upconverted and recognized by the SPCM simultaneously, a coincident event will be recorded by the TCSPC. The inset of Fig. 5 shows a typical time correlation histogram measured in the experiment at the heralding photon wavelength of 1503.45 nm. A clear main peak reveals the true coincidences of the correlated photon pairs. As the monochromator is scanning, the coincidence photon counts in the main peak are recorded as a function of the heralding photon wavelength as shown in Fig. 5. Hence, it can be concluded that the spectral quantum correlation is well retained in the frequency upconversion process. According to the JSI and the phase matching in the upconversion process, the MIR spectrum can be reproduced by the scanning wavelength of the heralding photons. In the experiment, the correlation spectrum covers 660 nm from 3140 nm to 3800 nm, which is mainly limited by the upconversion bandwidth together with the filtering system. By this means, the wavelength selection is only required in the spectral range of the heralding photons so that the MIR transmission spectrum can be obtained with high resolution and high sensitivity. MIR single-photon frequency upconversion spectroscopy based on temporal-spectral quantum correlation can be realized at the single-photon level with a broadband coincidence spectral bandwidth.
![]()
Figure 5.Coincidence spectrum by scanning the wavelength of the heralding photon. The shaded error band represents the standard deviation obtained from several independent measurements with an acquisition time of 90 s for each. Inset, time correlation histogram of photon pairs at the heralding photon wavelength of 1503.45 nm.
B. MIR Single-Photon Upconversion Quantum Spectroscopy
The performance of MIR upconversion quantum spectroscopy based on correlation is validated by the transmission spectral measurement of plastic samples. The sample is a piece of polystyrene (PS) film with a thickness of 38 μm and is inserted at the focal plane of a -system formed by and in Fig. 1. The diameter of the MIR beam spot on the sample is less than 100 μm. The transmission spectral measurement on the sample is carried out with an incident MIR photon flux of 0.09 average photons per pulse, corresponding to . We scan the monochromator while monitoring the coincidence peak variations with and without the sample insertion. As shown in Fig. 6, solid dots depict the result of the MIR upconversion quantum spectroscopy of the PS film. The distinct dips at about 3270 nm, 3310 nm, 3420 nm, and 3510 nm due to the strong absorption of PS can be observed clearly in the upconversion quantum spectroscopy. The theoretical spectral resolution of the current system is deduced to be about 11.4 nm (), mainly limited to the intrinsic spectral resolution of the NIR monochromator and the JSI of the SPDC photon pairs. Different samples are tested to prove the reliability of the system (more spectra of different samples can be found in the Appendix B). To verify the accuracy of our MIR upconversion quantum spectroscopy system, the transmission spectrum of the same sample is taken with a commercial FTIR spectrometer (Spotlight 400, PerkinElmer) with a spectral resolution of . The spectrum obtained in the MIR upconversion quantum spectroscopy system shows the exactly same profile as the one from the FTIR, indicating its capability for functional group analysis incorporated in a thin film at such low photon flux onto the samples. Compared to the conventional MIR frequency upconversion spectrum system, the incident MIR photon flux is reduced from 1.13 to 0.09 average photons per pulse, which is significant for the photosensitive biological sample analysis.
![]()
Figure 6.Transmission spectra of PS film with thickness of 38 μm. Dots represent the spectrum measured via the MIR upconversion spectroscopy system based on temporal-spectral quantum correlation. Solid line represents the spectrum measured via a commercial FTIR spectrometer as a comparison. The shaded error bands represent the accuracy of the transmittance spectrum obtained by the coincidence detection.
![]()
Figure 7.Measured photon number of heralding photons
5. CONCLUSION
To sum up, we demonstrate a broadband MIR upconversion quantum spectroscopy system. The temporal-spectral quantum correlation feature of the SPDC photon pair is well retained in the broadband MIR frequency upconversion process and fully utilized in the spectral measurement at very low incident photon flux. Owing to the temporal quantum correlation inherited by the upconverted photon and the heralding photon, highly sensitive MIR upconversion quantum spectroscopy can be achieved even when the noise generated in the upconversion process is too large to hide the upconverted photons. Meanwhile, the spectral quantum correlation is also maintained in the upconversion process, allowing the spectral analysis in the MIR regime at the single-photon level by wavelength resolved detection of the NIR heralding photons. The frequency upconversion efficiency in this system is deduced to be around 0.29% under 320 mW pump power. Recent research has revealed that the conversion efficiency of the MIR frequency upconversion system is approximately 80% [38]. However, it relies on periodically poled for narrow bandwidth photon conversion, which is incapable of achieving broadband MIR spectroscopy. In our experiment, the conversion efficiency is limited due to the short interaction length in the CPLN crystal, but it can be increased by augmenting the pump power or changing the pumping configuration. New crystal structures, such as the adiabatic SFG crystal or chirped waveguide [39,40], can also be used to increase upconversion efficiency. In the experiment, with a broadband MIR probe of only 0.09 average photons per pulse, the MIR transmission spectrum of the sample is obtained, which is difficult to achieve for the conventional MIR spectroscopy at such low incident MIR photon flux. Therefore, this MIR upconversion quantum spectroscopy system will be an effective scheme to study photosensitive samples by optically probing the extremely low flux of MIR photons. The system provides a competitive and highly sensitive single-photon detection solution with customizable operating wavelengths and can be promisingly applied to the measurement of photosensitive biochemical samples such as bio-chiral molecules in the future [41].
APPENDIX A: CHARACTERIZATION OF THE PHOTON-PAIR CORRELATIONS
To describe the photon-pair generation rate (PGR) based on the CPLN crystal, we have performed the coincidence detection between the heralding photons from the SPDC source and the upconverted MIR signal photons that comprise all frequency components. The SPDC heralding photon counting rate and upconverted photon counting rate subtracting the noise counts as a function of pump intensity for SPDC are, respectively, plotted in Fig.
The counting rate of the individual detector ( and ) and coincidence () are proportional to the pump intensity as the linear fit shown in Fig.
APPENDIX B: CHARACTERIZATION OF TRANSMISSION SPECTRA
To verify the applicability and reliability of the MIR upconversion quantum spectroscopy system, the transmission spectra of the commercial PS calibration film, polyethylene (PE) cling film, and polymethyl methacrylate (PMMA) film are measured with an average photon number per pulse of 0.09 and are shown in Fig.
![]()
Figure 8.Transmission spectra of plastic samples, including (a) 50 μm PS film, (b) PE cling film, and (c) 18.6 μm PMMA film that are measured by using the commercial FTIR spectrometer (lines) or MIR upconversion spectroscopy system based on the temporal-spectral quantum correlation (scatters). The shaded error bands represent the accuracy of the transmission spectrum obtained by the coincidence detection.

Set citation alerts for the article
Please enter your email address
© Copyright 2018-2021 | Chinese Laser Press. All Rights Reserved 沪ICP备15018463号-20