• Chinese Optics Letters
  • Vol. 20, Issue 9, 093201 (2022)
Hengyi Zheng1、2, Fukang Yin1、2, Tie-Jun Wang1、2、*, Yaoxiang Liu1, Yingxia Wei1, Bin Zhu3, Kainan Zhou3, and Yuxin Leng1、2
Author Affiliations
  • 1State Key Laboratory of High Field Laser Physics, Shanghai Institute of Optics and Fine Mechanics and CAS Center for Excellence in Ultra-intense Laser Science, Chinese Academy of Sciences, Shanghai 201800, China
  • 2Center of Materials Science and Optoelectronics Engineering, University of Chinese Academy of Sciences, Beijing 100049, China
  • 3Laser Fusion Research Center and Science & Technology on Plasma Physics Laboratory, China Academy of Engineering Physics, Mianyang 621999, China
  • show less
    DOI: 10.3788/COL202220.093201 Cite this Article Set citation alerts
    Hengyi Zheng, Fukang Yin, Tie-Jun Wang, Yaoxiang Liu, Yingxia Wei, Bin Zhu, Kainan Zhou, Yuxin Leng. Time-resolved measurements of electron density and plasma diameter of 1 kHz femtosecond laser filament in air[J]. Chinese Optics Letters, 2022, 20(9): 093201 Copy Citation Text show less
    Experimental setup for pump-probe-based diffractometry.
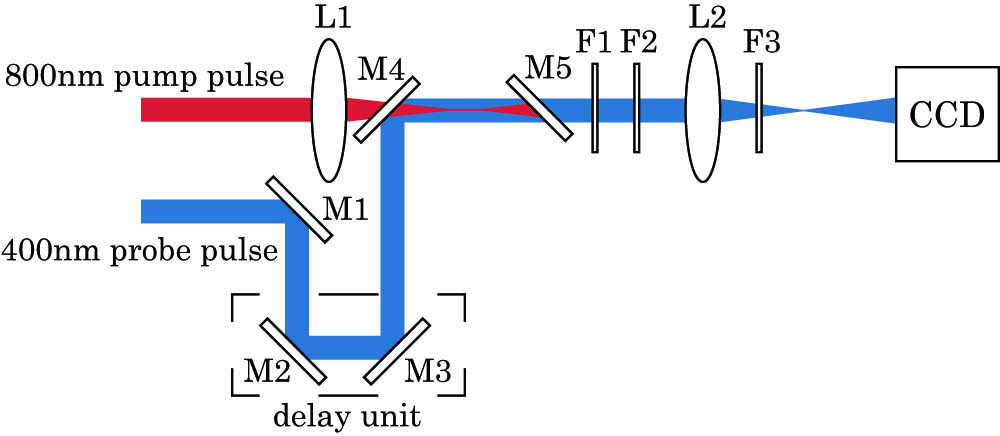
    Fig. 1. Experimental setup for pump-probe-based diffractometry.
    Images of the probe pulses recorded by CCD at different delay times. The negative sign in (a) and (b) denotes that the probe pulse is ahead of the pump pulse in time.
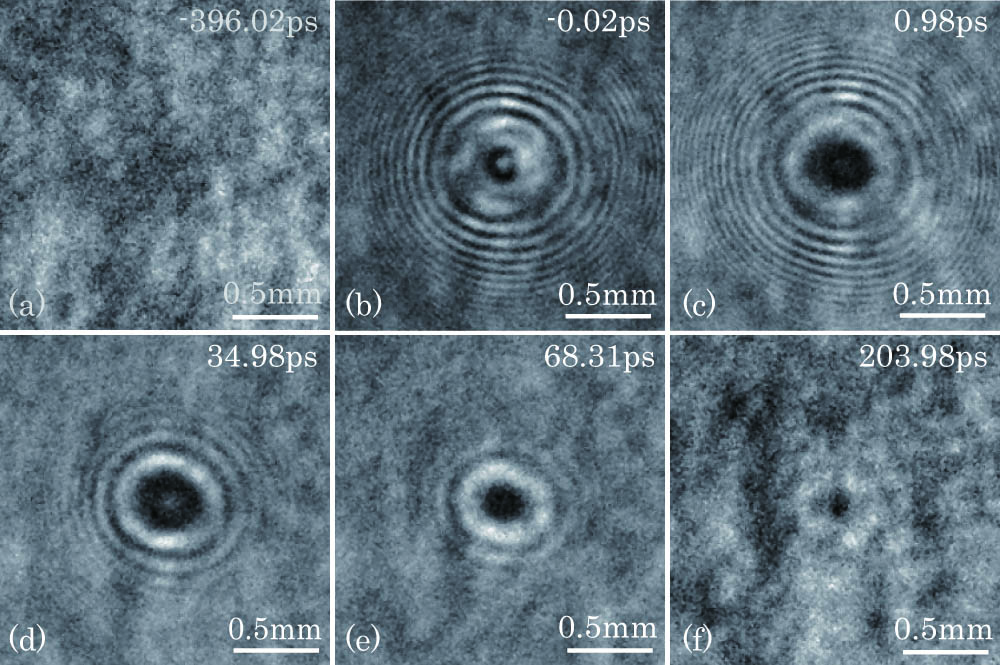
    Fig. 2. Images of the probe pulses recorded by CCD at different delay times. The negative sign in (a) and (b) denotes that the probe pulse is ahead of the pump pulse in time.
    Schematic diagram of calculating the propagation of the probe beam along the filament.
    Fig. 3. Schematic diagram of calculating the propagation of the probe beam along the filament.
    (a) Radial intensity distribution recorded by CCD at delay time −396 ps for low-density air channel. (b) Extracted transverse distribution of the refractive index variation in (a).
    Fig. 4. (a) Radial intensity distribution recorded by CCD at delay time −396 ps for low-density air channel. (b) Extracted transverse distribution of the refractive index variation in (a).
    (a) Simulated radial intensity distribution of probe beam at exit of the plasma channel when the delay time is 0.98 ps. (b) The diffraction fringe imaged on the CCD camera along radial direction at 0.98 ps. Blue solid-circle line is experimental data; orange solid line is the best fitting curve extracted from our simulation.
    Fig. 5. (a) Simulated radial intensity distribution of probe beam at exit of the plasma channel when the delay time is 0.98 ps. (b) The diffraction fringe imaged on the CCD camera along radial direction at 0.98 ps. Blue solid-circle line is experimental data; orange solid line is the best fitting curve extracted from our simulation.
    Temporal evolutions of (a) peak electron density and (b) filament diameter. The diamonds and squares are extracted from experimental results. The black solid curve is obtained by solving the rate equations of plasma decay. The inset figures are the zoom-in results near zero delay. (c) Transverse distribution of electron density at different delay times.
    Fig. 6. Temporal evolutions of (a) peak electron density and (b) filament diameter. The diamonds and squares are extracted from experimental results. The black solid curve is obtained by solving the rate equations of plasma decay. The inset figures are the zoom-in results near zero delay. (c) Transverse distribution of electron density at different delay times.
    Hengyi Zheng, Fukang Yin, Tie-Jun Wang, Yaoxiang Liu, Yingxia Wei, Bin Zhu, Kainan Zhou, Yuxin Leng. Time-resolved measurements of electron density and plasma diameter of 1 kHz femtosecond laser filament in air[J]. Chinese Optics Letters, 2022, 20(9): 093201
    Download Citation