
Xin Zhong, Xinwei Wang, Liang Sun, Yan Zhou. Enhancement of rapid lifetime determination for time-resolved fluorescence imaging in forensic examination[J]. Chinese Optics Letters, 2021, 19(4): 041101
- Chinese Optics Letters
- Vol. 19, Issue 4, 041101 (2021)
Abstract
Keywords
1. Introduction
Imaging techniques have been widely employed in forensic[
2. Enhanced Rapid Lifetime Determination Imaging Method
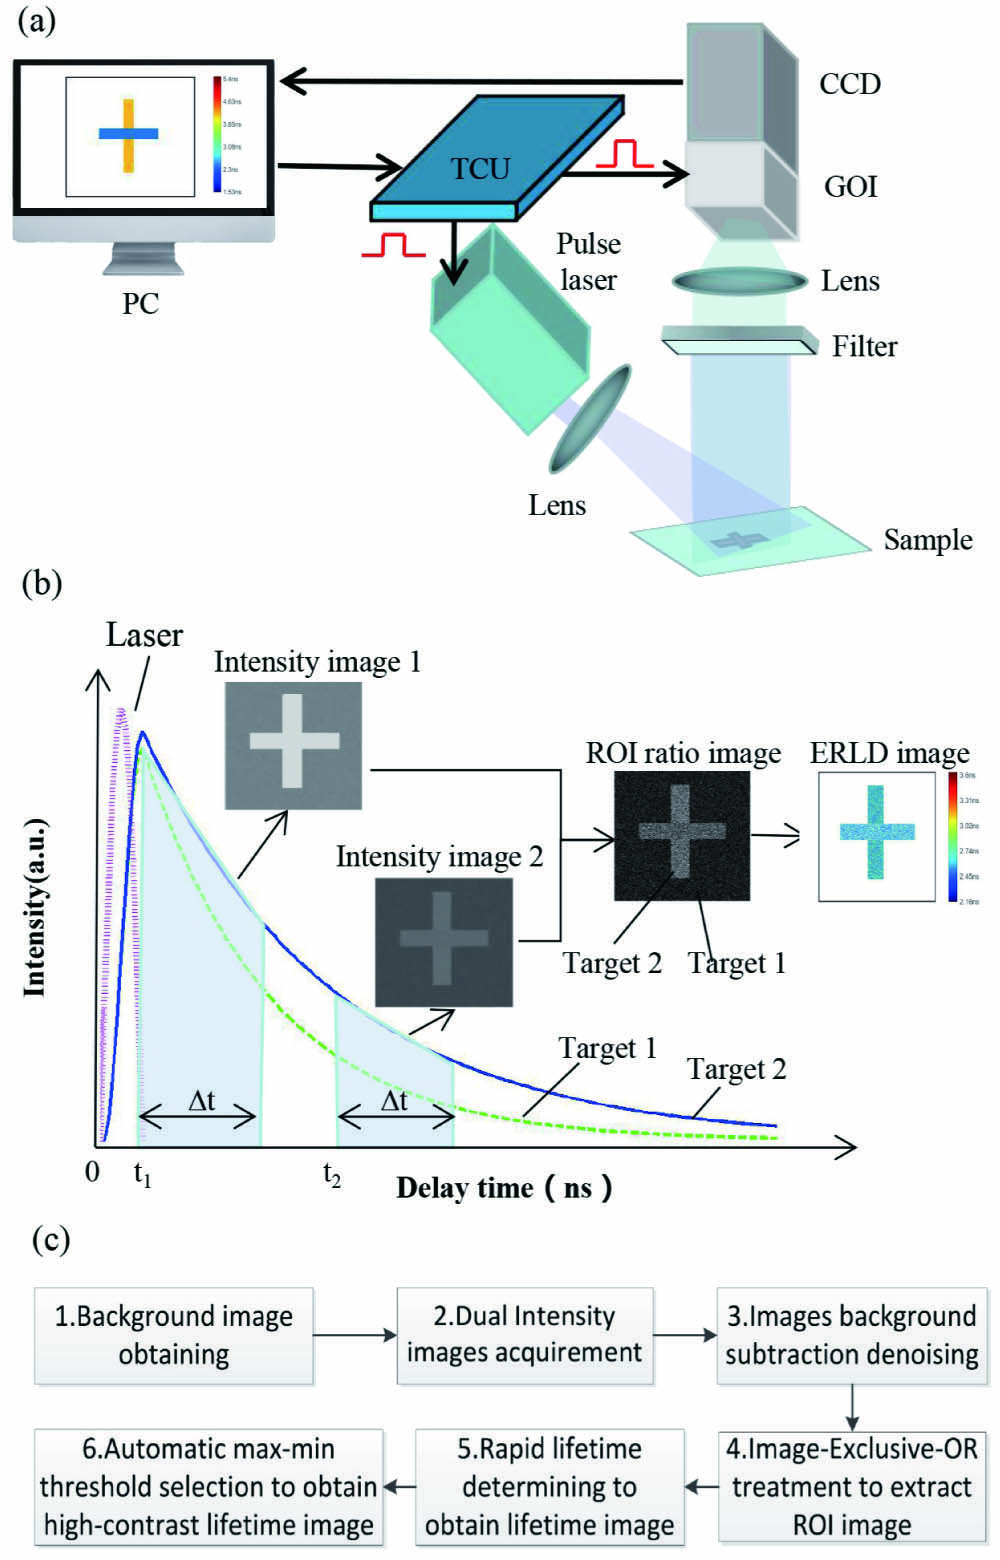
As shown in Fig. 1(a), a typical wide-field TRFI system consists of a pulsed laser, a gated optical intensifier (GOI), a charge-coupled device (CCD) camera, and timing control unit (TCU). The TCU controls the GOI gate time, CCD exposure time, and the laser pulse width, simultaneously. The ERLD method is based on a wide-field TRFI system, and its principle is illustrated in Fig. 1. A UV laser with picosecond-scaled pulse width is used to generate excitation light. The output laser irradiates the fluorescence substances. The excited fluorescence is generated and reflected to the GOI. This nanosecond-scaled GOI is operated at the same repetition rate as the laser. GOI is coupled to the CCD camera. TCU generates delay time to trigger GOI and CCD to grasp TRFI images.
![]()
Figure 1.(a) Schematic diagram of the wide-field TRFI system, (b) principle of the ERLD method, and (c) process diagram of the ERLD method.
In Fig. 1(a), the given target of the cross letter “+” is written on the paper. The “ | ” and “−” are written by different highlighters. The interference of fluorescence substances and the background noise lead to low contrast time-resolved intensity images. Here, the ERLD method is proposed, and it involves six steps, as shown in Fig. 1(c).
Sign up for Chinese Optics Letters TOC. Get the latest issue of Chinese Optics Letters delivered right to you!Sign up now
In Fig. 1(b), two time-resolved fluorescence intensity images are grasped at different delay times. The gate time of two intensity images is equal as . When there are different substances, the single intensity image for multiple substances is given as
Two intensity images are processed in six steps to finally obtain contrast enhanced lifetime images, as shown in Fig. 1(c). The detailed instructions of the six steps are as follows.
The first step is background image acquisition at no incident light. obtains the intensity of environmental noise and system noise. The second step is to acquire two intensity images at two different delay times. The third step is the subtraction of background to remove the environmental noise and system noise and generate a new intensity image :
The fourth step is to further suppress the noise. As shown in Eq. (3), there is effective information and residual noise in . It leads to low contrast images. Hence, the image-exclusive-OR treatment is presented to extract the region of interest (ROI) from the two new images and . Then, the ratio image of the two intensity images can be obtained as
When the gray value of the intensity image at the delay time or is smaller than the filter threshold, the value of the corresponding pixel is set to zero. In order to evaluate the effect of contrast enhancement, the image variance is applied as
The fifth step is the lifetime image obtained by Eq. (5):
To improve the lifetime image contrast, the gray contrast enhancement is used as the sixth step. As shown in Eq. (6), when the gray value of is smaller than the minimum threshold of and greater than the maximum threshold of , it is set to , and otherwise the grayscale stretching is used:
Due to the fluorescence delay function, should be larger than . Hence, is larger than zero. can be automatically set to the minimum non-zero value. is selected based on the contrast of the lifetime image. The contrast of the enhanced lifetime image is expressed by the effective variance as
After all six steps have been completed, pseudo-color coding is used to improve the visibility of the enhanced image, and a fluorescence lifetime image is finally obtained. The maximum and minimum limits of the colorbar of the pseudo-color image are and , respectively.
In addition, when the environment and the test objects are unchanged, the filter threshold and maximum and minimum threshold values can also be fixed after being automatically obtained. It is not necessary to find the thresholds again.
The ERLD method enhances the visualization of lifetime fluorescence imaging for finely distinguishing fine detection. To prove the feasibility of the proposed method, verification experiments are conducted. The RLD method is a classic fluorescence lifetime algorithm. ERLD and RLD methods are both using two time-resolved images, but our method gives priority to suppress noise and automatically improve the contrast of the lifetime image. In order to illustrate the difference, we introduce the traditional TRFI and RLD methods to compare the image contrast.
3. Experiment and Results
In experiments, a wide-field TRFI system has been established. The narrow-pulse UV laser is a PicoQuant PDL800-B type with the laser pulse width of 50 ps at the wavelength of 375 nm. The gated sensor is a PI-MAX4 intensified CCD (ICCD) from Princeton Instruments with a minimum optical gate width of 3 ns and pixels. A field-programmable gate array (FPGA) is used as a time control unit to synchronize the pulsed laser and the gated ICCD. A 400 nm cut-off filter is used in front of the lens to block the reflected UV light.
To prove the proposed method, we choose two bands of highlighters in the same color, and they cannot be distinguished by the naked eye. The spectral information of GUANGBO and M&G is 520 nm and 527 nm, respectively. Different brands of highlighters contain different proportions of chemicals and, thus, have different fluorescence lifetimes. The paper we used also has fluorescence characteristics, and the fluorescence of papers affects the fluorescence image quality.
In Fig. 2(a), two highlighters of GUANGBO and M&G are marked on the paper. The difference in fluorescence lifetime between GUANGBO and M&G is small. Figures 2(b) and 2(c) are a TRFI intensity image and a traditional RLD image, respectively. One cannot distinguish the deference of the marks clearly. Especially in Fig. 2(c), the effective information is completely covered by an invalid value. Because of the influence of interference noise, there is a very large deviation in the calculated lifetime image obtained by the traditional RLD method. In comparison, the difference of highlighters is revealed in Fig. 2(d) through the ERLD method. The horizontal and the vertical marks are marked with different colors and can be better distinguished by the naked eye. According to Fig. 2(d) obtained by the ERLD method, the maximum and minimum limits of the colorbar scale are manually selected for Fig. 2(c), and the result is shown in Fig. 2(e). It also obtains high-contrast images, but the contrast of the image is worse than that of the ERLD image. It is mainly because the image-exclusive-OR treatment of ERLD can effectively remove interference noise. In the experiment, the delay time is the time gap between the incident laser pulse and the optical gate pulse. In Fig. 2(b), the delay time is 7 ns, and the optical gate time is 5 ns. In Figs. 2(c) and 2(d), they have the same first delay time of and the same second delay time of , and the optical gate time is 5 ns.
![]()
Figure 2.Experimental results of cross letter written by M&G and GUANGBO under different methods: (a) target picture, (b) intensity image, (c) traditional RLD image, (d) ERLD image, and (e) manual RLD image.
Figure 3 shows the variance changes with the filter threshold and maximum and minimum thresholds. When the filter threshold increases, the image variance changes dramatically in Fig. 3(a), and the fluctuation is due to the interference signal. Figure 3 demonstrates that the filter threshold and maximum threshold are chosen when the image variances are the maximum, and the minimum threshold is set to the minimum non-zero value.
![]()
Figure 3.Variance distribution with (a) filter threshold and (b) maximum and minimum thresholds in ERLD images.
To prove that the proposed method is also available in obliterated document examination, Fig. 4(a) is a letter A written by M&G and then covered by GUANGBO to make it invisible. The ERLD image of Fig. 4(c) can clearly show the letter A from the mask due to different lifetimes, although the mark is slightly different in intensity. The manual RLD image of Fig. 4(d) also has high contrast by setting the same maximum and minimum limits of the colorbar according to Fig. 4(c). In other words, if there is no reference of the colorbar from Fig. 4(c), one needs to manually choose the colorbar scale, and it is not convenient in practical applications of forensic examination. Furthermore, because there is no image-exclusive-OR treatment processing, the residual interference noise exists in Fig. 4(d). In Fig. 4(b), the delay time is 14 ns, and the optical gate time is 5 ns. In Figs. 4(c) and 4(d), they have the same first delay time of and the same second delay time of , and the optical gate time is 5 ns.
![]()
Figure 4.Results of obliterated document: (a) target picture, (b) intensity image, (c) ERLD image, and (d) manual RLD image.
To evaluate the proposed method, the contrasts of global images are given, as shown in Table 1. The contrast of the global image is used to assess the quality of the whole image. The contrast of the global image is defined as the root mean square deviation of the effective pixels’ gray values from the mean pixel gray values of the image, divided by the global image’s mean gray values[
| Intensity Image | ERLD Image | Manual RLD Image | |
|---|---|---|---|
| Fig. | 0.0475 | 1.4580 | 0.8485 |
| Fig. | 0.0667 | 2.2987 | 0.5586 |
Table 1. Different Contrast of Three Methods
4. Conclusion
Multi-fluorescence overlap is difficult to distinguish in wide-field TRFI for forensic casework. This paper has proposed an ERLD method to remove environmental noise, system noise, and residual interference noise. The proposed method enhances fluorescence lifetime image contrast and improves the visualization performance of TRFI. Compared with traditional TRFI and RLD methods, the proposed method can maintain a high contrast and automatically make the lifetime image easier to be observed. Moreover, the experiment results show that the ERLD method can automatically select maximum and minimum thresholds to remove unwanted noise and improve lifetime image contrast by grayscale stretching. Even when the difference in fluorescence lifetime is small, the proposed method can still distinguish different fluorescent substances.
References
[3] T. Liu, H. Liu, Y. Li, Z. Zhang, S. Liu. Efficient blind signal reconstruction with wavelet transforms regularization for educational robot infrared vision sensing. IEEE Trans. Ind. Inform., 24, 384(2019).
[4] T. Liu, H. Liu, Z. Chen, A. M. Lesgold. Fast blind instrument function estimation method for industrial infrared spectrometers. IEEE Trans. Ind. Inform., 14, 5268(2018).
[7] Y. Chen, R. M. Clegg. Fluorescence lifetime-resolved imaging. Photosynth. Res., 102, 143(2009).

Set citation alerts for the article
Please enter your email address
© Copyright 2018-2021 | Chinese Laser Press. All Rights Reserved 沪ICP备15018463号-20