
Junqing Dong, Qinghui Li, Yongqing Hu. Multi-technique analysis of an ancient stratified glass eye bead by OCT, μ-XRF, and μ-Raman spectroscopy[J]. Chinese Optics Letters, 2020, 18(9): 090001
- Chinese Optics Letters
- Vol. 18, Issue 9, 090001 (2020)
Abstract
Keywords
Some of the optical and spectroscopic techniques that were initially developed for the fields of chemistry, biology, biomedicine, materials sciences, and geology are used as important methods to characterize the micro-structure, elemental composition, coloring and opacifying agents, and secondary phases of archaeological materials. The common techniques are optical microscopy, optical coherence tomography (OCT)[
As a non-contact method, OCT technology can quickly and conveniently generate high-resolution cross-sectional and three-dimensional images of the subsurface of transparent and translucent materials. μ-XRF is a nondestructive technique for simultaneous qualitative and quantitative analyses of chemical components of points, lines, and areas. μ-RS can obtain information on both microscopic morphology and the phase at the same time; especially, for ancient material, it can also identify pigments and opacifiers, as well as provide further information on the type of glassy matrix. For instance, Colomban and coworkers have analyzed great quantities of archaeological glasses and glazed ceramics by means of Raman spectroscopy (RS)[
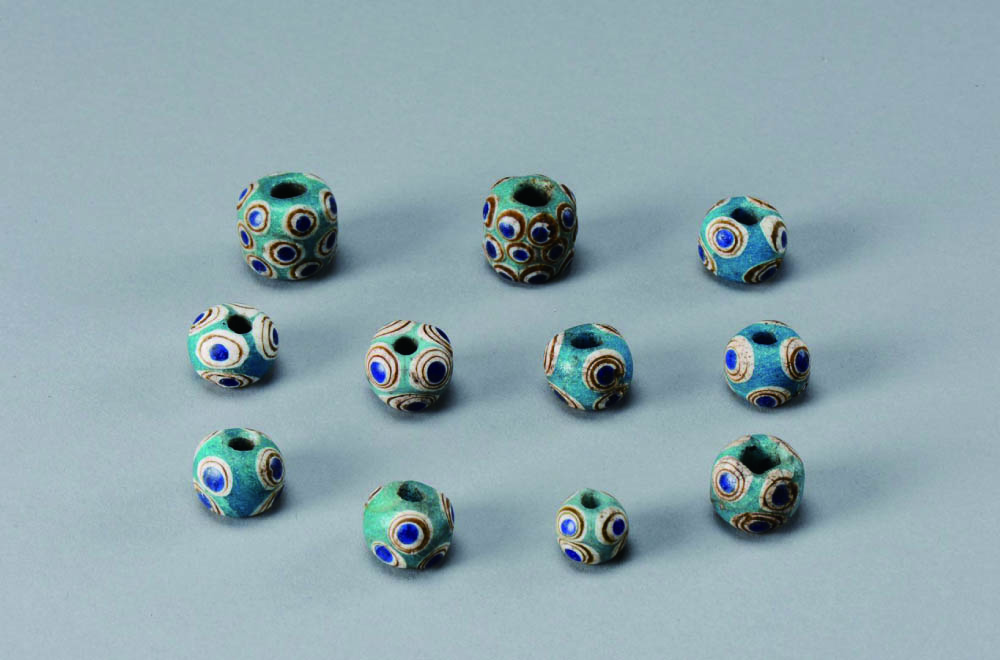
The eye bead (Fig.
Sign up for Chinese Optics Letters TOC. Get the latest issue of Chinese Optics Letters delivered right to you!Sign up now
![]()
Figure 1.Eye beads unearthed from Chu tomb in Xujialing, Xichuan, Henan Province.
In previous studies, some scholars have analyzed eye beads unearthed in Xujialing and Shenmingpu, Henan Province, Leigudun, Wangshan, and Jiudian, Hubei Province, and Lijiaba, Hunan Province using PIXE[
In this Letter, we report a combined investigation on the material, chemical composition, phase, fluxing agent, colorant, cross-sectional structure, craftsmanship, and provenance of an ancient eye bead using non-destructive swept source OCT (HSL-2100, Santec, Japan)[
![]()
Figure 2.Micrograph and 3D pseudo-color OCT images of the eye bead HXX-M10. (a) Micrograph of the broken bead; (b) top view and the position; (c) slice perpendicular to the
Firstly, we obtain the 3D pseudo-color images of the eye bead and the slice images at different angles using OCT (Fig.
The bead was scanned in detail by OCT to obtain more structure characteristics of different color regions. Figure
![]()
Figure 3.2D-OCT images of eye bead HXX-M10.
From the two-dimensional (2D)-OCT images, it can be seen that the white and brown layers are uneven in thickness, and the cross sections of the dark blue eye ball, white layers, and brown layers shrink gradually from the surface to the bottom. The decreasing tendency and the different transparencies of the four color regions also could be observed by optical microscopy (Fig.
![]()
Figure 4.Microscopic images of the fragments of eye bead HXX-M10.
In order to ascertain the chemical composition of four color regions in the eye bead, a μ-XRF was used for elemental mapping and quantitative analysis under vacuum to improve the detection sensitivity of light elements. It was equipped with three types of optical illumination, coaxial (reflection), around (dark field), and transmission. Combining coaxial and around illuminations enables clear observation of samples with uneven or reflective areas. The spectrometer operates with a rhodium (Rh) X-ray tube and an energy dispersive, peltier cooled silicon drift detector, capable of detecting elements from sodium (Na) to uranium (U). The small X-ray spot size (down to 10 μm) and high spatial resolution allow for detailed analysis of the particles of tens of microns in size. In this Letter, analysis was carried out with the 100 μm X-ray beams. The mapping width and height are 8.448 mm (128 pixel) and 9.240 mm (128 pixel), respectively. Operational conditions were 50 kV tube high voltage, 0.5 mA tube current, and 20 s per point analysis time. Mapping analysis shows differences in chemical elements of the dark blue eye ball, turquoise blue matrix, brown layers, and white layers, which is closely related to cobalt and iron, copper, iron, and manganese, and calcium and antimony, respectively. Moreover, it seems that some antimony atoms are also present into the dark blue and brown regions (Fig.
![]()
Figure 5.Element mapping for eye bead HXX-M10 shows that the dark blue area has a correlation with elements of Co and Fe, the white area with Sb and Ca, the brown area with Fe and Mn, and the blue matrix with Cu. The lighter shade corresponds to higher concentrations.
Quantitative chemical analyses reflect the typical composition of a natron-type soda-lime-silicate () glass (Table
| Color | MgO | Cl | CaO | CoO | CuO | ZnO | PbO | SrO | BaO | ||||||||||||
|---|---|---|---|---|---|---|---|---|---|---|---|---|---|---|---|---|---|---|---|---|---|
| Mapping area | 9.78 | 0.63 | 4.14 | 70.56 | 0.45 | 0.84 | 9.29 | n.d. | 0.79 | 0.01 | 0.28 | 2.67 | 0.03 | n.d. | n.d. | n.d. | 0.46 | 0.03 | 0.03 | n.d. | |
| Dark blue | 1 | 7.79 | 0.58 | n.d. | 76.30 | 0.49 | 1.01 | 8.32 | 0.09 | 2.23 | 0.11 | 0.35 | 2.44 | n.d | 0.07 | 0.05 | 0.01 | 0.11 | 0.04 | n.d. | n.d. |
| 2 | 15.81 | 0.35 | n.d. | 70.48 | n.d. | 0.77 | 7.44 | 0.07 | 1.94 | 0.10 | 0.28 | 2.29 | n.d | 0.06 | 0.09 | 0.01 | 0.27 | 0.03 | n.d. | n.d. | |
| 3 | 2.37 | 1.02 | 1.36 | 78.33 | n.d. | 1.24 | 9.73 | 0.12 | 2.51 | 0.13 | 0.42 | 1.94 | n.d. | 0.08 | 0.09 | 0.01 | 0.50 | 0.05 | 0.12 | n.d. | |
| 4 | 6.26 | 0.48 | n.d. | 77.01 | 0.68 | 0.07 | 9.06 | 0.11 | 2.48 | 0.13 | 0.40 | 2.47 | n.d. | 0.08 | 0.12 | 0.01 | 0.42 | 0.06 | 0.16 | n.d. | |
| 5 | 12.74 | 0.38 | n.d. | 73.27 | n.d. | 0.85 | 8.00 | 0.08 | 1.98 | 0.10 | 0.32 | 1.54 | n.d. | 0.06 | 0.10 | 0.01 | 0.37 | 0.04 | 0.17 | n.d. | |
| Average | 8.99 | 0.56 | 0.27 | 75.08 | 0.23 | 0.79 | 8.51 | 0.09 | 2.23 | 0.11 | 0.35 | 2.14 | 0.07 | 0.09 | 0.01 | 0.33 | 0.04 | 0.09 | |||
| STD | 4.76 | 0.24 | 0.54 | 2.84 | 0.29 | 0.39 | 0.80 | 0.02 | 0.24 | 0.01 | 0.05 | 0.35 | 0.01 | 0.02 | 0.00 | 0.13 | 0.01 | 0.08 | |||
| Turquoise blue | 1 | 8.75 | n.d. | 0.44 | 78.72 | 0.46 | 1.65 | 7.39 | 0.06 | 0.37 | n.d. | 1.04 | 0.35 | n.d. | n.d. | 0.19 | 0.06 | 0.41 | 0.04 | 0.08 | n.d. |
| 2 | 20.07 | n.d. | 0.35 | 70.78 | 0.37 | 1.14 | 5.75 | 0.04 | 0.27 | n.d. | 0.72 | 0.10 | 0.01 | n.d. | 0.11 | 0.04 | 0.12 | 0.03 | 0.10 | n.d. | |
| 3 | 0.34 | n.d. | 0.39 | 86.44 | 0.47 | 1.46 | 7.84 | 0.08 | 0.41 | n.d. | 1.20 | 0.42 | n.d. | n.d. | 0.31 | 0.06 | 0.41 | 0.04 | 0.11 | n.d. | |
| Average | 9.72 | 0.39 | 78.65 | 0.43 | 1.42 | 6.99 | 0.06 | 0.35 | 0.99 | 0.29 | n.d. | n.d. | 0.20 | 0.05 | 0.31 | 0.04 | 0.10 | ||||
| STD | 8.08 | 0.04 | 6.39 | 0.04 | 0.21 | 0.90 | 0.02 | 0.06 | 0.20 | 0.14 | 0.00 | n.d. | 0.08 | 0.01 | 0.14 | 0.00 | 0.01 | ||||
| Brown | 1 | 22.11 | n.d. | 1.24 | 65.61 | 0.45 | 1.16 | 6.12 | 0.15 | 0.76 | n.d. | 0.01 | 1.82 | 0.06 | 0.01 | 0.05 | 0.01 | 0.41 | 0.03 | n.d. | n.d. |
| 2 | 2.41 | n.d. | 0.92 | 82.28 | 0.68 | 0.98 | 8.07 | 0.12 | 0.94 | n.d. | 0.06 | 2.83 | 0.07 | 0.02 | 0.08 | 0.01 | 0.33 | 0.04 | 0.15 | n.d. | |
| 3 | 1.53 | n.d. | 0.99 | 82.56 | 0.70 | 1.01 | 7.81 | 0.13 | 0.93 | n.d. | 0.02 | 3.15 | 0.07 | 0.02 | 0.10 | 0.01 | 0.65 | 0.05 | 0.27 | n.d. | |
| 4 | 1.35 | n.d. | 0.43 | 82.89 | 0.73 | 0.92 | 8.26 | 0.14 | 0.97 | n.d. | 0.02 | 2.84 | 0.08 | 0.02 | 0.09 | 0.01 | 1.06 | 0.05 | 0.14 | 0.02 | |
| Average | 6.85 | 0.90 | 78.34 | 0.64 | 1.02 | 7.57 | 0.14 | 0.90 | 0.03 | 2.66 | 0.07 | 0.02 | 0.08 | 0.01 | 0.61 | 0.04 | 0.14 | 0.01 | |||
| STD | 8.82 | 0.29 | 7.35 | 0.11 | 0.09 | 0.85 | 0.01 | 0.08 | 0.02 | 0.50 | 0.01 | 0.00 | 0.02 | 0.00 | 0.28 | 0.01 | 0.06 | 0.00 | |||
| White | 1 | 7.24 | 0.92 | 0.62 | 79.67 | 0.74 | 0.01 | 7.24 | 0.10 | 0.68 | n.d. | 0.01 | 2.09 | 0.05 | n.d. | 0.05 | 0.01 | 0.55 | 0.04 | n.d. | n.d. |
| 2 | 0.49 | n.d. | 0.66 | 80.46 | 0.55 | 0.79 | 9.38 | n.d. | 0.54 | n.d. | 0.02 | 6.32 | 0.03 | n.d. | 0.09 | 0.02 | 0.61 | 0.05 | n.d. | n.d. | |
| 3 | 13.07 | n.d. | 0.69 | 75.46 | n.d. | 0.02 | 6.94 | n.d. | 0.46 | n.d. | 0.01 | 2.61 | 0.02 | n.d. | 0.10 | 0.02 | 0.55 | 0.04 | n.d. | n.d. | |
| 4 | 13.23 | 0.22 | n.d. | 71.58 | n.d. | n.d | 10.49 | n.d. | 0.37 | n.d. | 0.01 | 3.33 | 0.02 | n.d. | 0.06 | 0.03 | 0.44 | 0.04 | 0.19 | n.d. | |
| 5 | 0.12 | n.d. | 0.92 | 82.18 | n.d. | 0.06 | 8.13 | n.d. | 0.57 | n.d. | 0.04 | 6.81 | 0.03 | n.d. | 0.11 | 0.02 | 0.63 | 0.05 | 0.34 | n.d. | |
| 6 | 19.54 | n.d. | 0.28 | 68.26 | n.d. | 0.46 | 5.33 | n.d. | 0.28 | n.d. | 0.01 | 5.22 | 0.01 | n.d. | 0.03 | 0.01 | 0.38 | 0.03 | 0.14 | n.d. | |
| 7 | 0.13 | n.d. | 0.38 | 78.26 | n.d. | 0.62 | 8.32 | n.d. | 0.59 | n.d. | 0.04 | 10.46 | 0.02 | n.d. | 0.22 | 0.05 | 0.64 | 0.05 | 0.24 | n.d. | |
| 8 | 20.97 | n.d. | 0.79 | 64.94 | 0.39 | 0.47 | 7.36 | n.d. | 0.35 | n.d. | 0.01 | 3.94 | 0.02 | n.d. | 0.06 | 0.02 | 0.56 | 0.03 | 0.10 | n.d. | |
| Average | 9.35 | 0.14 | 0.54 | 75.10 | 0.21 | 0.30 | 7.90 | 0.01 | 0.48 | 0.02 | 5.10 | 0.03 | 0.09 | 0.02 | 0.55 | 0.04 | 0.13 | ||||
| STD | 8.07 | 0.30 | 0.28 | 5.83 | 0.28 | 0.29 | 1.47 | 0.03 | 0.13 | 0.01 | 2.57 | 0.01 | 0.06 | 0.01 | 0.09 | 0.01 | 0.12 | ||||
| Lower detection limit (ppm) | 350 | 150 | 100 | 50 | 10 | 10 | 10 | 1 | 1 | 1 | 1 | 1 | 1 | 0.1 | 1 | 0.5 | 10 | 0.1 | 1 | 0.1 | |
Table 1. Chemical Composition of the Eye Glass Bead HXX-M10 Unearthed from Chu Tomb in Xujialing by μ-XRF
Considering the heterogeneity of the ancient glass artifact, several points of each color region were analyzed (the measurement positions are reported in the Supplementary Materials) to avoid the subjective one-sidedness of random sampling as much as possible, and the averages of each measured color region were also listed in Table
![]()
Figure 6.
To characterize the phases of the different color regions, confocal μ-RS was used for non-destructive analysis of the eye bead. The amorphous states were quite easily discriminated by the Si–O stretching (i.e., ) and bending () envelopes in the dark blue, turquoise blue, and brown white color regions [Fig.
![]()
Figure 7.Raman spectra of different color regions of eye bead HXX-M10. (a) Raman spectra of dark blue eye ball, turquoise blue matrix, and brown layer; (b)
The non-destructive technique of OCT, supplemented with a digital microscope, provided a quick and easy view of the cross-section structure and uniformity. μ-XRF proved to be a highly effective method for non-destructive analysis of the multicolored glass eye beads unearthed in the Henan Province. Different color regions can be detected quickly through high-speed screening and can be visualized using image processing. However, the main limitation of μ-XRF is the impossibility of identifying the chemical compounds. This difficulty could be overcome using μ-RS. On the other hand, RS cannot detect colorants in glass if they are transition ions. The complementary use of different techniques is necessary for full identification of the information present in ancient glass. These data reveal that the eye bead is a stratified glass produced by hot-working, i.e., the turquoise blue matrix was firstly produced, and then the white layers, brown layers, and the dark blue eye ball were successively embedded into the matrix in a semi-solidified state. The ancient glass maker consciously chose different coloring materials to produce the multicolored glass beads. Dark blue, turquoise blue, and brown colors originate from ions of Co, Cu, and Fe and Mn, respectively. Beyond the transition metal ions, chemical compounds, for example, the hexagonal , are a key factor in the white layers of the glass bead. It was used to produce an opaque white color, as a representative colorant and opacifier in the ancient Egypt and Eastern Mediterranean areas. We can conclude that the eye bead is typical western ancient natron-type soda-lime glass introduced to China through the Northern Silk Road from Egypt or the Eastern Mediterranean areas. It is a witness of the cultural and economic exchanges between China and foreign countries about 1400 years ago.
This Letter is devoted to exploring a new non-destructive combination of analytical techniques for the study of the cross-section structures, fluxing agents, colorants, and micro-phases of an archaeological multicolored stratified glass eye bead. This work demonstrates the possibility of deriving effectively and conveniently the information on glass-making technology, chemical systems, and provenance, using the different complementary techniques without any sampling or sample preparation in line with the recommended ethical guidelines for cultural heritage research. The combination could be widely used for researching cultural heritage such as porcelain, glazed pottery, faience, polychrome ceramic, wall painting, and jade artifacts.
References
[2] J. Q. Dong, Q. H. Li, X. Yan. Chin. J. Nat., 5, 325(2015).
[4] F. X. Gan, Q. H. Li, J. Henderson. Recent Advances in the Scientific Research on Ancient Glass and Glaze(2016).
[6] F. X. Gan, H. S. Cheng, Y. Q. Hu, B. Ma, D. H. Gu. Sci. Chin. Technol. Sc., 52, 922(2009).
[7] P. Colomban. Appl. Phys. A, 79, 167(2004).
[8] J. Q. Dong, Q. H. Li, S. Liu. X-Ray Spectrom., 44, 458(2015).
[9] C. Kharmyssov, M.W. L. Ko, J. R. Kim. Chin. Opt. Lett., 17, 011701(2019).
[12] A. G. Attaelmanan. X-Ray Spectrom., 43, 325(2015).
[13] D. X. Zhong, M. S. Guo, Y. Q. Hu, S. Liu, J. Q. Dong, Q. H. Li. Spectrosc. Spect. Anal., 39, 178(2019).
[14] X. Yan, J. Q. Dong, Q. H. Li, M. S. Guo, Y. Q. Hu. Chin. J. Lasers, 41, 0908001(2014).
[16] K. Yamagiwa, S. Fujimoto, H. Aoyama, J. Izumi, S. Kameshima, T. Arakaki. J. Archaeol. Sci. Rep., 26, 101879(2019).
[19] P. Colomban. J. Non-Cryst. Solids., 323, 180(2003).
[20] P. Colomban, T. Aurélie, L. Bellot-Gurlet. J. Raman Spectrosc., 37, 841(2006).
[21] A. Tournié, L. C. Prinsloo, P. Colomban. J. Raman Spectrosc., 532, 43(2011).
[22] H. C. Beck. Archaeologia, 77, 1(1928).
[23] S. M. Kwan. Early Chinese Glass(2001).
[24] Q. H. Li, S. Liu, H. X. Zhao, F. X. Gan, P. Zhang. Archaeometry, 56, 601(2014).
[25] H. X. Zhao, Q. H. Li, S. Liu, F. X. Gan. J. Raman Spectrosc., 44, 643(2013).
[26] Q. H. Li, J. Q. Dong. Natl. Pal. Mus. Mon. Chin. Art, 421, 42(2018).
[27] D. Y. Zhao. Acta Arch. Sin., 2, 177(2012).
[28] S. Liu, F. X. Gan, Q. H. Li. Spectrosc. Lett., 48, 302(2015).
[29] H. X. Zhao, Q. H. Li. J. Raman Spectrosc., 48, 1103(2017).
[30] A. Bonneau, J. F. Moreau, R. G. Hancock, K. Karklins. Beads, 26, 35(2014).
[31] J. Q. Dong, Q. H. Li, S. Liu. X-Ray Spectrom.(2020).
[32] S. Liu, Q. H. Li, Q. Fu, F. X. Gan, Z. M. Xiong. X-Ray Spectrom., 42, 470(2013).
[33] S. Liu, Q. H. Li, F. X. Gan, J. Lankton. J. Archaeol. Sci., 39, 2128(2012).
[34] M. García-Heras, J. M. Rincón, A. Jimeno, M. A. Villegas. J. Archaeol. Sci., 32, 727(2005).
[35] K. H. Wedepohl. Glas in Antike und Mittelalter: Geschichte eines Werkstoffs(2003).
[36] E. Husson, Y. Repelin, M. T. Vandenborre. Spectrochim. Acta A, 40, 1017(1984).
[37] M. S. Tite, A. J. Shortland. Production Technology of Family and Related Early Vital Materials(2008).
[38] J. Xie. A Raman spectroscopy study of hyperfine structure of aluminosilicate and feldspar(2008).

Set citation alerts for the article
Please enter your email address
© Copyright 2018-2021 | Chinese Laser Press. All Rights Reserved 沪ICP备15018463号-20