• High Power Laser Science and Engineering
  • Vol. 9, Issue 4, 04000e63 (2021)
J. Bromage*, S.-W. Bahk, M. Bedzyk, I. A. Begishev, S. Bucht, C. Dorrer, C. Feng, C. Jeon, C. Mileham, R. G. Roides, K. Shaughnessy, M. J. Shoup, M. Spilatro, B. Webb, D. Weiner, and J. D. Zuegel
Author Affiliations
  • Laboratory for Laser Energetics, University of Rochester, Rochester, NY14623, USA
  • show less
    DOI: 10.1017/hpl.2021.45 Cite this Article Set citation alerts
    J. Bromage, S.-W. Bahk, M. Bedzyk, I. A. Begishev, S. Bucht, C. Dorrer, C. Feng, C. Jeon, C. Mileham, R. G. Roides, K. Shaughnessy, M. J. Shoup, M. Spilatro, B. Webb, D. Weiner, J. D. Zuegel. MTW-OPAL: a technology development platform for ultra-intense optical parametric chirped-pulse amplification systems[J]. High Power Laser Science and Engineering, 2021, 9(4): 04000e63 Copy Citation Text show less
    EP-OPAL schematic showing two options for pumping the final amplifiers, NOPA6, for the two 25-PW beamlines that are seeded by a common front end.
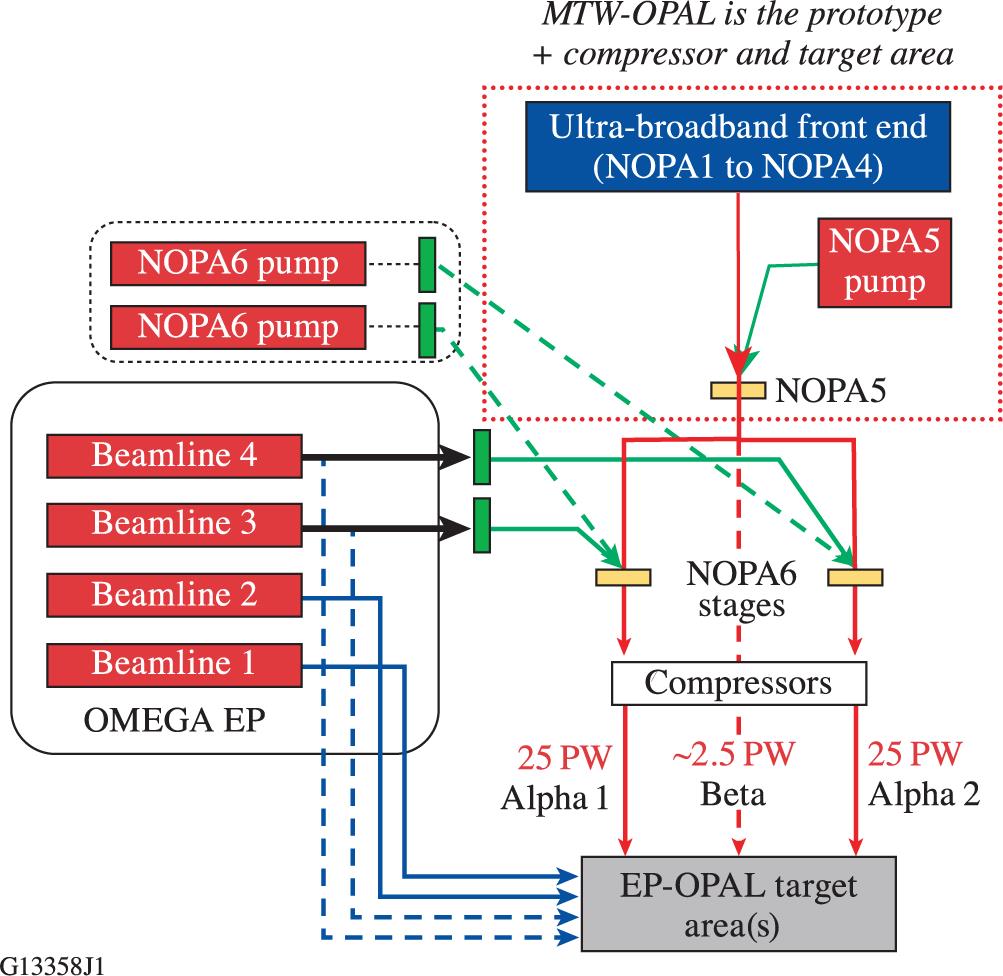
    Fig. 1. EP-OPAL schematic showing two options for pumping the final amplifiers, NOPA6, for the two 25-PW beamlines that are seeded by a common front end.
    The MTW-OPAL system in relation to the existing MTW laser. The MTW laser is reconfigured using three switchyards. Portions of the MTW laser that are not used for pumping the final amplifier stage of the OPAL (NOPA5) are shown in gray. UFE, ultra-broadband front end; DCP, diagnostic compressor package; OPA, optical parametric amplifier.
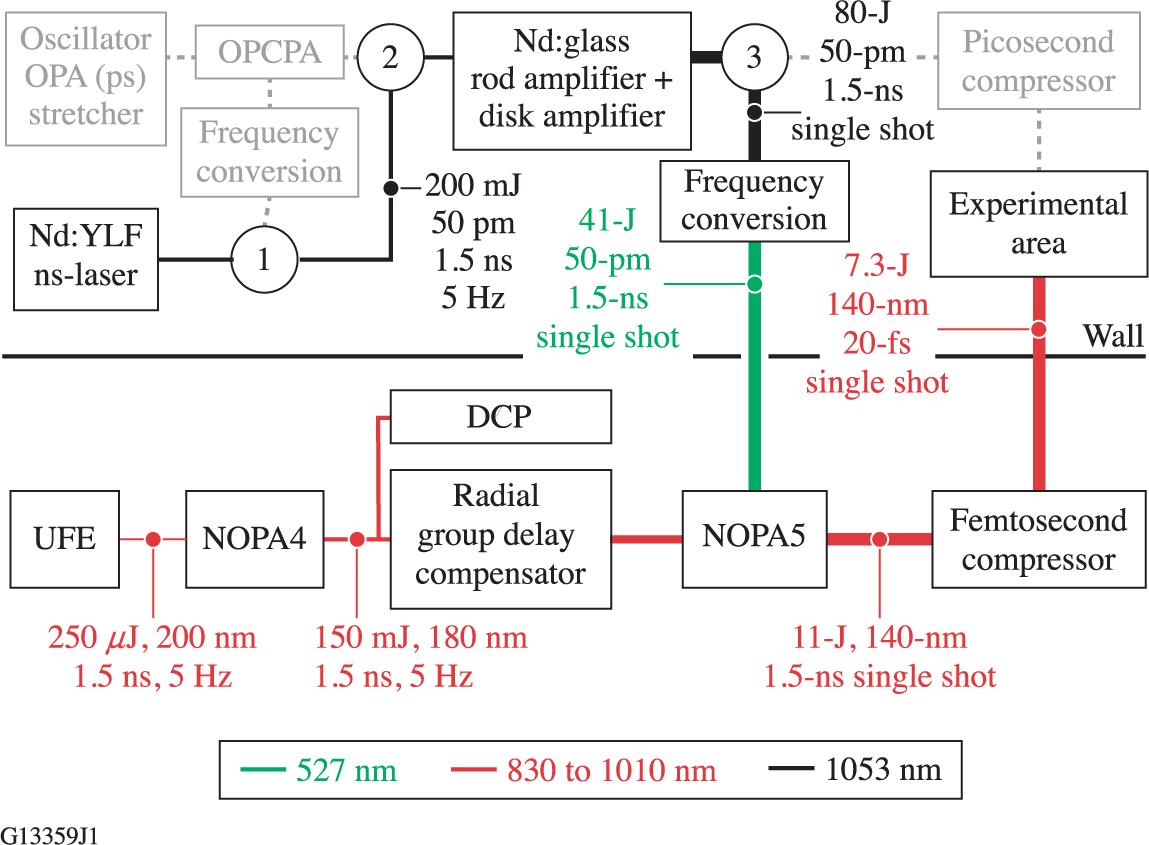
    Fig. 2. The MTW-OPAL system in relation to the existing MTW laser. The MTW laser is reconfigured using three switchyards. Portions of the MTW laser that are not used for pumping the final amplifier stage of the OPAL (NOPA5) are shown in gray. UFE, ultra-broadband front end; DCP, diagnostic compressor package; OPA, optical parametric amplifier.
    (a) Measured pump-beam profile after correction using a liquid crystal-based, programmable spatial light modulator (PSLIM). (b) Measured pump-pulse shape after correction using an adaptive pulse-shaping system in the MTW front end, with a fit to a 34th-order super-Gaussian.
    Fig. 3. (a) Measured pump-beam profile after correction using a liquid crystal-based, programmable spatial light modulator (PSLIM). (b) Measured pump-pulse shape after correction using an adaptive pulse-shaping system in the MTW front end, with a fit to a 34th-order super-Gaussian.
    (a) Photograph and (b) schematic of the NOPA5 amplifier showing top and side views of the geometry required to achieve pump−signal beam combination with a subdegree noncollinear angle (angles exaggerated).
    Fig. 4. (a) Photograph and (b) schematic of the NOPA5 amplifier showing top and side views of the geometry required to achieve pump−signal beam combination with a subdegree noncollinear angle (angles exaggerated).
    (a) An example of tuning-curve measurements at the optimum noncollinear angle (0.32°) for a nominal 70% deuteration level where the gain peaks for the two wavelengths are aligned. (b) Measured versus nominal deuteration levels for all tested crystals with error bars showing the 95% confidence interval.
    Fig. 5. (a) An example of tuning-curve measurements at the optimum noncollinear angle (0.32°) for a nominal 70% deuteration level where the gain peaks for the two wavelengths are aligned. (b) Measured versus nominal deuteration levels for all tested crystals with error bars showing the 95% confidence interval.
    Schematic of the refractive image relays from the output of the UFE to the input of the compressor showing amplifier and image plane locations. The inset shows the predicted RGD with and without the compensator.
    Fig. 6. Schematic of the refractive image relays from the output of the UFE to the input of the compressor showing amplifier and image plane locations. The inset shows the predicted RGD with and without the compensator.
    (a) Broadband niobia/hafnia/silica multilayer dielectric coating that was optimized for the MTW-OPAL wavelength range. (b) A broadband-enhanced metal reflector (BEMR) that provides adequate reflectivity (98% versus 99.5%) and is necessary for p-polarized applications.
    Fig. 7. (a) Broadband niobia/hafnia/silica multilayer dielectric coating that was optimized for the MTW-OPAL wavelength range. (b) A broadband-enhanced metal reflector (BEMR) that provides adequate reflectivity (98% versus 99.5%) and is necessary for p-polarized applications.
    Computer aided design drawing of the grating compressor chamber (GCC). Inset: finite element analysis of the monolithic breadboard, which is supported by eight legs that are mechanically isolated from the main vessel using vacuum bellows.
    Fig. 8. Computer aided design drawing of the grating compressor chamber (GCC). Inset: finite element analysis of the monolithic breadboard, which is supported by eight legs that are mechanically isolated from the main vessel using vacuum bellows.
    Schematic of the grating compressor chamber showing the major subsystems and main beam path (dark blue); the pre-shot, low-energy beam path for shot setup (orange); and the diagnostic beam paths used for on-shot diagnostics (light blue). Inset: the location of the NOPA5 apodizer used to define the beam edges and the sample beam that is picked off for the vacuum SPIDER measurement.
    Fig. 9. Schematic of the grating compressor chamber showing the major subsystems and main beam path (dark blue); the pre-shot, low-energy beam path for shot setup (orange); and the diagnostic beam paths used for on-shot diagnostics (light blue). Inset: the location of the NOPA5 apodizer used to define the beam edges and the sample beam that is picked off for the vacuum SPIDER measurement.
    (a) Gain of the NOPA5 stage versus pump energy, showing good agreement across a broad range between the measured and simulated values. (b) Corresponding spectra for four pump energies: input (gray), measured output (red) and simulated output (black).
    Fig. 10. (a) Gain of the NOPA5 stage versus pump energy, showing good agreement across a broad range between the measured and simulated values. (b) Corresponding spectra for four pump energies: input (gray), measured output (red) and simulated output (black).
    (a) Simulated NOPA5 output spectra for ideal input spectra (black dashed line) for a range of deuteration levels (70% to 98%). (b) Corresponding Fourier transform-limited pulse width.
    Fig. 11. (a) Simulated NOPA5 output spectra for ideal input spectra (black dashed line) for a range of deuteration levels (70% to 98%). (b) Corresponding Fourier transform-limited pulse width.
    (a) Pump-beam fluence map measured before the NOPA5 stage. (b) Amplified signal fluence measured after the NOPA5 apodizer for a full-energy shot. (c) Corresponding pump fluence measured after the NOPA5 stage. Note that (a) and (c) are plotted with the same color scale to show the degree of pump depletion for the saturated amplifier.
    Fig. 12. (a) Pump-beam fluence map measured before the NOPA5 stage. (b) Amplified signal fluence measured after the NOPA5 apodizer for a full-energy shot. (c) Corresponding pump fluence measured after the NOPA5 stage. Note that (a) and (c) are plotted with the same color scale to show the degree of pump depletion for the saturated amplifier.
    (a) Spectral domain measurements (spectral density and phase) made by the vacuum SPIDER device for a full-energy shot. (b) The corresponding reconstructed pulse.
    Fig. 13. (a) Spectral domain measurements (spectral density and phase) made by the vacuum SPIDER device for a full-energy shot. (b) The corresponding reconstructed pulse.
    Reconstructed pulse measurements with the full NOPA4 bandwidth (NOPA5 not pumped), showing the average pulse (red line), one standard deviation from the mean (red-shaded region) and the Fourier transform-limited pulse (black line).
    Fig. 14. Reconstructed pulse measurements with the full NOPA4 bandwidth (NOPA5 not pumped), showing the average pulse (red line), one standard deviation from the mean (red-shaded region) and the Fourier transform-limited pulse (black line).
    Temporal power contrast of the NOPA4 pulses measured using a third-order cross-correlator (Sequoia®) after compression using the DCP.
    Fig. 15. Temporal power contrast of the NOPA4 pulses measured using a third-order cross-correlator (Sequoia®) after compression using the DCP.
    EnergeticsTemporal and spectral propertiesSpatial and angular properties
    FirstDesignFirstDesignFirstDesign
    MetriclightgoalMetriclightgoalMetriclightgoal
    NOPA5 pump energy (max, rms)41.7 J (1.4%)50 JNOPA4 bandwidth175 nm (FW10%)>180 nm (FW10%)NOPA5 signal beam modulation1.4:1 (peak-to-mean)<1.8:1 (peak-to-mean)
    NOPA5 transfer efficiency30%>25%NOPA5 bandwidth140 nm (FW10%)>175 nm (FW10%)GCC output pointing stability (rms)3 μrad (horiz.) 10 μrad (vert.)<25 μrad (rms)
    NOPA5 signal energy (max, rms)11.2 J (4.0%)12.5 JCompressed pulse width17 fs (NOPA4) 20 fs (NOPA5) (FWHM)15 fs (FWHM)Wavefront (rms)0.09λ (NOPA5) 0.18λ (GCC out)<0.075λ
    GCC output energy7.3 J>7 JPrepulse contrast (at DCP)<10–10 (–150 ps)<10–10, assuming adding plasma mirror(s)Strehl ratio0.78 (NOPA5) 0.88 (77% CA)>0.8, assuming wavefront correction
    Sufficient NOPA5 energy withGood compression of availableMeeting beam quality and pointing;
    better efficiency than expected;bandwidth and ordered 95% DKDPjust upgraded GCC mirrors; buying
    ramping the GCC to 7.3 J, 85%for more; planning forfinal OAP for full-beam focusing.
    of available energy.double-plasma mirror.
    Table 1. Summary of primary results and design goals for the MTW-OPAL Laser System.
    J. Bromage, S.-W. Bahk, M. Bedzyk, I. A. Begishev, S. Bucht, C. Dorrer, C. Feng, C. Jeon, C. Mileham, R. G. Roides, K. Shaughnessy, M. J. Shoup, M. Spilatro, B. Webb, D. Weiner, J. D. Zuegel. MTW-OPAL: a technology development platform for ultra-intense optical parametric chirped-pulse amplification systems[J]. High Power Laser Science and Engineering, 2021, 9(4): 04000e63
    Download Citation