• Chinese Optics Letters
  • Vol. 18, Issue 7, 071903 (2020)
Shijia Hua1, Kang Du1, Heng Wang1, Wending Zhang1, Ting Mei1、*, and Elhadj Dogheche2
Author Affiliations
  • 1Key Laboratory of Space Applied Physics and Chemistry, Ministry of Education, and Shaanxi Key Laboratory of Optical Information Technology, School of Science, Northwestern Polytechnical University, Xi’an 710072, China
  • 2Université Polytechnique Hauts de France, IEMN DOAE CNRS, Campus Le Mont Houy, 59309, Valenciennes Cedex, France
  • show less
    DOI: 10.3788/COL202018.071903 Cite this Article Set citation alerts
    Shijia Hua, Kang Du, Heng Wang, Wending Zhang, Ting Mei, Elhadj Dogheche. Affirming nonlinear optical coefficient constancy from z-scan measurement[J]. Chinese Optics Letters, 2020, 18(7): 071903 Copy Citation Text show less
    (a)–(i) OA and (a’)–(i’) CA normalized transmittances as functions of the position z of CS2 samples with thicknesses of (a)–(c), (a’)–(c’) 2 mm, (d)–(f), (d’)–(f’) 1 mm, and (g)–(i), (g’)–(i’) 0.5 mm under intensities of (a), (d), (g), (a’), (d’), (g’) 967 GW/cm2, (b), (e), (h), (b’), (e)’, (h’) 764 GW/cm2, and (c), (f), (i), (c’), (f’), (i’) 500 GW/cm2. Green circles represent experimental data. Fitting results are given by BPDM (red lines) and SBM (blue dashed lines), respectively.
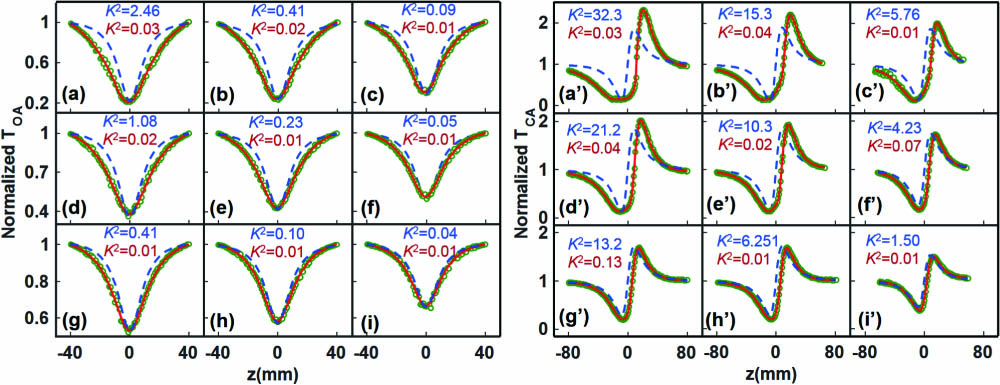
    Fig. 1. (a)–(i) OA and (a’)–(i’) CA normalized transmittances as functions of the position z of CS2 samples with thicknesses of (a)–(c), (a’)–(c’) 2 mm, (d)–(f), (d’)–(f’) 1 mm, and (g)–(i), (g’)–(i’) 0.5 mm under intensities of (a), (d), (g), (a’), (d’), (g’) 967GW/cm2, (b), (e), (h), (b’), (e)’, (h’) 764GW/cm2, and (c), (f), (i), (c’), (f’), (i’) 500GW/cm2. Green circles represent experimental data. Fitting results are given by BPDM (red lines) and SBM (blue dashed lines), respectively.
    Fitting curves of (a) OA and (a’) CA transmittances by two models for sample thickness of 1 mm and laser peak intensity of 967 GW · cm−2 shown in Figs. 1(d) and 1(d’), with (b)–(d) intensity distributions and (b’)–(d’) phase distributions at the exit plane of the sample at z=−25, 0, 20 mm. Blue dashed lines and red lines are curves simulated using SBM and BPDM, respectively. The brown dotted lines in (b)–(d), (b’)–(d’) are plotted at the entrance plane of the sample.
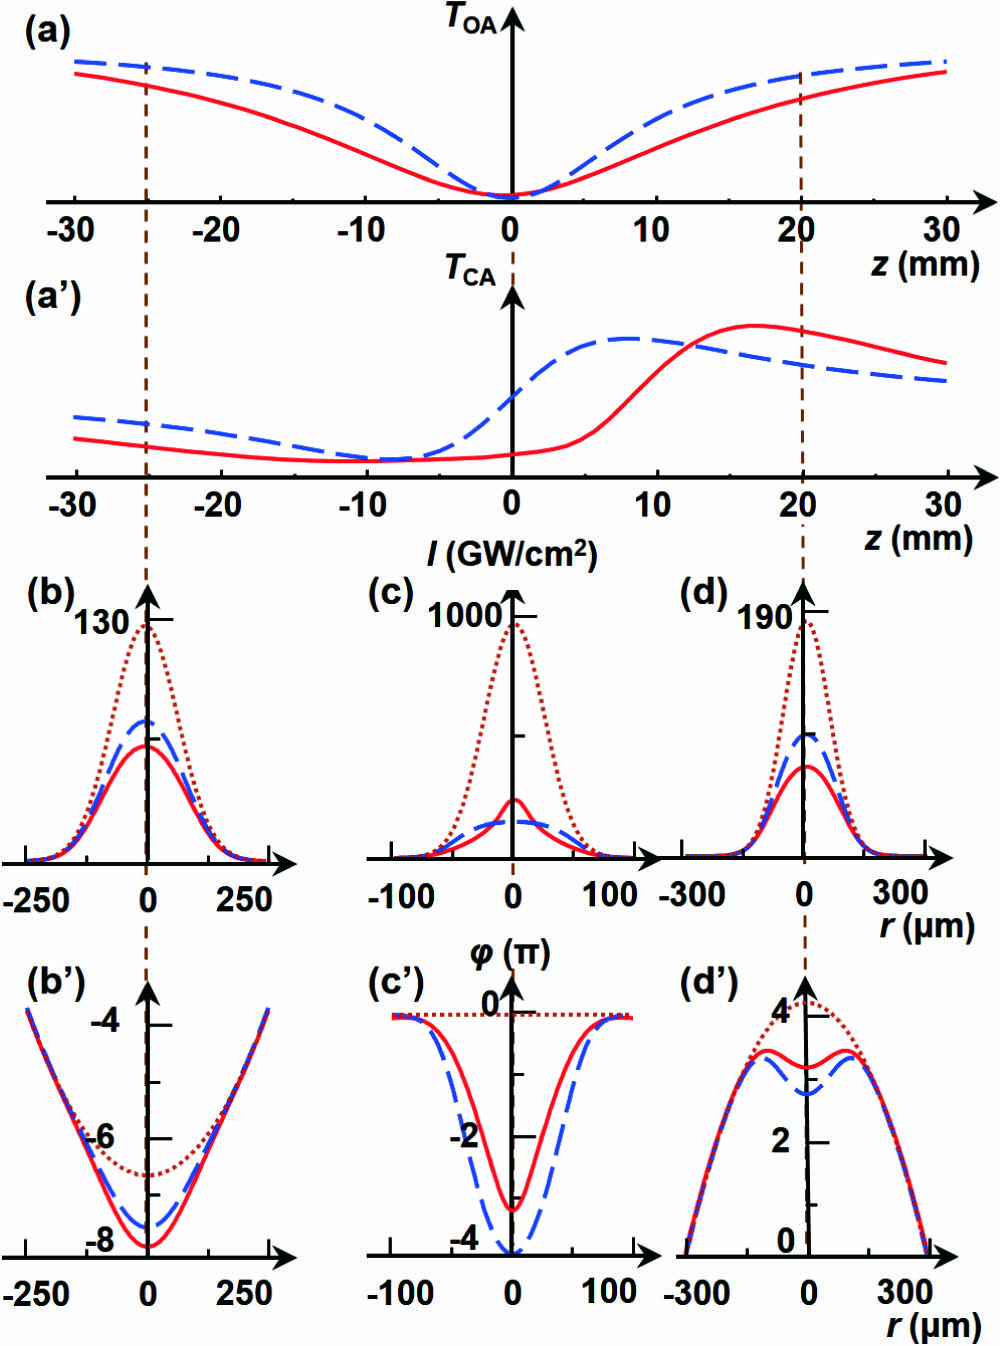
    Fig. 2. Fitting curves of (a) OA and (a’) CA transmittances by two models for sample thickness of 1 mm and laser peak intensity of 967GW·cm2 shown in Figs. 1(d) and 1(d’), with (b)–(d) intensity distributions and (b’)–(d’) phase distributions at the exit plane of the sample at z=25, 0, 20 mm. Blue dashed lines and red lines are curves simulated using SBM and BPDM, respectively. The brown dotted lines in (b)–(d), (b’)–(d’) are plotted at the entrance plane of the sample.
    (a) NLA and (b) NLR coefficients versus I0·L obtained by fitting the z-scan data shown in Fig. 1 using SBM (hollow marks) and BPDM (solid marks) for samples of thicknesses 0.5 mm, 1 mm, and 2 mm (orange circle, brown triangle, and pink square marks). Blue–violet diamond marks are results obtained from the literature[8,1214" target="_self" style="display: inline;">–14,16]. The 95% confidence interval bars are drawn with magnification factors of 1, 5, and 10 for results of the literature, SBM, and BPDM.
    Fig. 3. (a) NLA and (b) NLR coefficients versus I0·L obtained by fitting the z-scan data shown in Fig. 1 using SBM (hollow marks) and BPDM (solid marks) for samples of thicknesses 0.5 mm, 1 mm, and 2 mm (orange circle, brown triangle, and pink square marks). Blue–violet diamond marks are results obtained from the literature[8,1214" target="_self" style="display: inline;">–14,16]. The 95% confidence interval bars are drawn with magnification factors of 1, 5, and 10 for results of the literature, SBM, and BPDM.
    Shijia Hua, Kang Du, Heng Wang, Wending Zhang, Ting Mei, Elhadj Dogheche. Affirming nonlinear optical coefficient constancy from z-scan measurement[J]. Chinese Optics Letters, 2020, 18(7): 071903
    Download Citation