
Xiaoqing SONG, Mengmeng WEN, Yajing SHEN, Qi FENG, Jingwei XIANG, Weina ZHANG, Guosong ZHAO, Zhifeng WU. Urban vacant land in growing urbanization: An international review[J]. Journal of Geographical Sciences, 2020, 30(4): 669
- Journal of Geographical Sciences
- Vol. 30, Issue 4, 669 (2020)
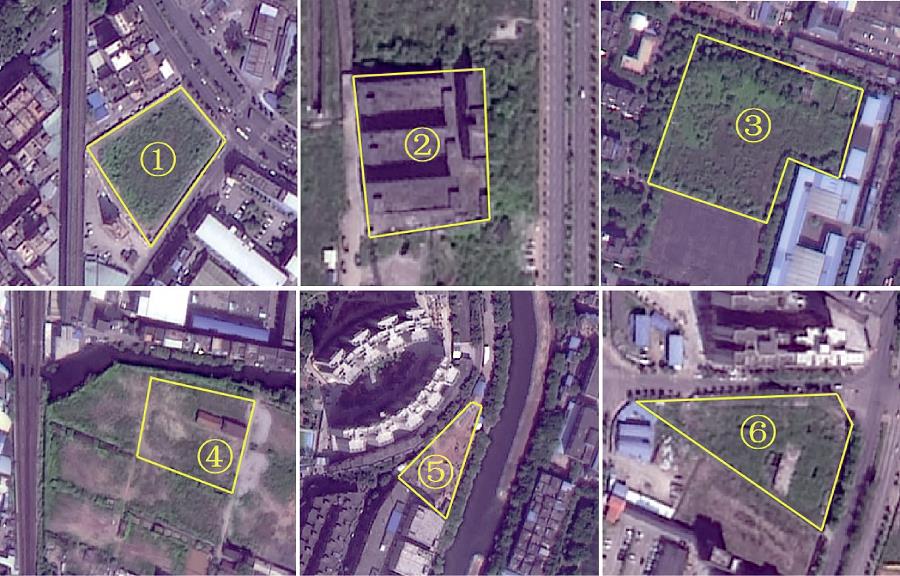
Fig. 1. Images of urban vacant land in the case study area in Guangzhou City, China, 2016Note: The data were produced by the authors using a high-resolution remote sensing image, combining a street view and field survey (1. Wild grassland; 2. Abandoned building land; 3. Wild grass mixed with shrub and tree land; 4. Abandoned building mixed with bare land; 5. Bare land; 6. Abandoned building mixed with wild grassland).
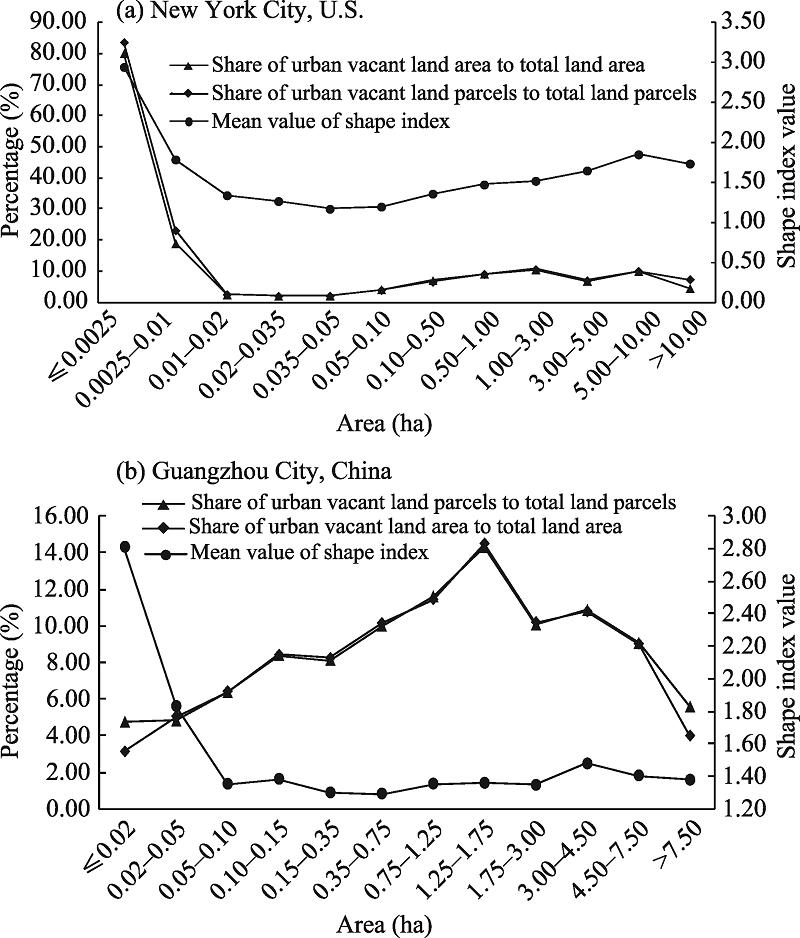
Fig. 2. Comparison of the morphologies of urban vacant land in the case study area in Guangzhou and New York City, 2016Note: The vacant land data pertaining to New York City were obtained from the NYC Department of City Planning (https://www1.nyc.gov/site/planning/data-maps/open-data.page ); the vacant land data pertaining to Guangzhou City in southern China were produced by the authors using a high-resolution remote sensing image, combining a street view and field survey.
Fig. 3. Distribution pattern of urban vacant land in typical transects in Guangzhou, 2016Note: The data were produced by the authors using a high- resolution remote sensing image, combining a street view and field survey
Fig. 4. Distribution pattern of urban vacant land in New York City, 2016.Note: The data were obtained from the NYC Department of City Planning (https://www1.nyc.gov/site/planning/data-maps/open-data.page ).
Fig. 5. Distribution pattern of urban vacant land in Chicago, 2017Note: The space coordinates of vacant land parcels were from the City of Chicago (https://www.cityofchicago.org/city/en.html ).
Fig. 6. Distribution pattern of share of urban vacant land area in Philadelphia, 2010Note: The data were obtained from ATACANGROUP (https://www.centercityrealestate.com/philadelphia-real-estate-blog/philadelphias-vacant-landissuses/ ).
Fig. 7. Distribution pattern of urban vacant land in Saskatoon, Canada, 2016Note: “Density” denotes the density of urban vacant land parcel; “economic density” denotes the density of commercial and industrial businesses at the neighborhood level. Vacant land data and data of commercial and industrial businesses were taken from the Vacant Lot Inventory and the Annual Report of Businesses Information for the City of Saskatoon, which were released by the city hall (https://www.saskatoon.ca/ ).
Fig. 8. Distribution pattern of urban vacant housing land in 65 cities, U.S., 2015
| ||||||||||||||||||||||||||||||||||||||||||
Table 1.
Types of urban vacant land in the Guangzhou City case study, 2016
| |||||||||||||||||||||||||||||||||||||
Table 2.
Types of urban vacant land in New York City, 2016 (Parcel, ha, %)
| |||||||||||||||||||||||||||||||||||||||
Table 3.
Morphologic characteristics of urban vacant land parcels in New York City, 2016
| ||||||||||||||||||||||||||||||||||||||||||||||||||||||||||
Table 4.
Morphologic characteristics of urban vacant land parcels in the typical transect area of Guangzhou City, China, 2016

Set citation alerts for the article
Please enter your email address
© Copyright 2018-2021 | Chinese Laser Press. All Rights Reserved 沪ICP备15018463号-20