• Journal of Geographical Sciences
  • Vol. 30, Issue 4, 669 (2020)
Xiaoqing SONG1、2、*, Mengmeng WEN1, Yajing SHEN1, Qi FENG1, Jingwei XIANG3, Weina ZHANG2, Guosong ZHAO1, and Zhifeng WU4
Author Affiliations
  • 1Research Center for Spatial Planning and Human-Environment System Simulation, School of Geography and Information Engineering, China University of Geosciences, Wuhan 430074, China
  • 2Hunan Key Laboratory of Land Resources Evaluation and Utilization, Hunan Planning Institute of Land and Resources, Changsha 410007, China
  • 3School of Public Administration, China University of Geosciences, Wuhan 430074, China
  • 4School of Geographical Sciences, Guangzhou University, Guangzhou 510006, China
  • show less
    DOI: 10.1007/s11442-020-1749-0 Cite this Article
    Xiaoqing SONG, Mengmeng WEN, Yajing SHEN, Qi FENG, Jingwei XIANG, Weina ZHANG, Guosong ZHAO, Zhifeng WU. Urban vacant land in growing urbanization: An international review[J]. Journal of Geographical Sciences, 2020, 30(4): 669 Copy Citation Text show less

    Abstract

    Urban growth and shrinkage constitute the overall pattern of growing urbanization across the globe. Studies on urban vacant land (UVL) are few, and have proved to be mainly rudimentary and subjective. This paper first presents the definition of UVL based on bibliometric analysis. Typology, morphology, proximate causes, and the multiple functions of UVL are then analyzed at parcel, transect, city, and national levels based on an international review. Results show that UVL can be categorized by land cover, land usage, and land ownership. Worldwide, UVL has been widespread and extensive. For example, the occurrence probabilities of UVL in the cases of Guangzhou and New York are 8.46%-8.88% and 3.17%-5.08%, respectively. The average vacancy rate of residential land amounts to 11.48% in 65 U.S. cities. Generally, UVL shows fragmentation and irregular shape, and significant spatial differences exist at parcel, transect, city, and national levels. Proximate causes, such as excessive land division, irregularly shaped land parcels, decreases in resident population, deindustrialization, land speculation, insufficient investment, and environmental concerns, can all result in UVL. Currently, UVL has become a gray area of social, economic, and ecological space. However, it can also be considered a potential resource for enhancing urban sustainability. Policy implications to promote urban sustainability using monitoring, control, and differential revitalization of UVL are presented.

    1 Introduction

    The global urbanization boom began with industrialization from the 1870s to the 1950s. In the 1960s, with the rapid development of metropolises in developed regions, such as Western Europe and North America, urbanization began to spread, promoting a second global urbanization boom. According to statistical data from the World Bank, the global urban population increased from 1.02 billion to 4.20 billion between 1960 and 2018, with a corresponding increase in demographic urbanization levels from 33.61% to 55.27% (IBRD-IDA, 2019). Meanwhile, global urban land sprawled rapidly. For example, it increased by 5.80×10⁴ km2 between 1970 and 2000. In 2010, urban land area accounted for about 3% of global land area, excluding Antarctica and Greenland (Liu et al., 2014). According to projections, the world’s urban population is expected to reach 6.3 billion in 2050 (UN, 2014; 2019), and urban land area may increase to 318.20×10⁴ km2 by 2050 (Angel et al., 2010). One might conclude that urban growth will typify urbanization during the 21st century (Jiang and Neil, 2017).

    However, according to statistical data from the World Bank, the share of the global population in urban agglomerations totaling more than one million increased from 14.14% to 24.01% between 1960 and 2018. This increase was much lower than the global increase in the demographic urbanization level of 21.66%. Meanwhile, the share of the population in the largest city as a percentage of the total urban population decreased from 17.58% to 16.11% (IBRD-IDA, 2019). This divergence is particularly prominent in developed countries in Europe and the United States. For example, in the United States, the share of the total population in urban agglomerations of more than one million increased from 38.73% to 46.26% between 1960 and 2018, while the share of the total urban population in the largest city decreased from 11.20% to 6.99% (IBRD-IDA, 2019). For the largest city in the United States, New York City, the population grew slowly from 7.89 million to 8.55 million between 1950 and 2015. However, for the most populous regions of New York City, Brooklyn and Manhattan, population size decreased by 137.49×10³ and 348.02×10³ (NYC Open Data, 2019), respectively. During this time, the urban populations of Chicago, Philadelphia, Detroit, Washington, and Boston decreased by 900.42×10³, 504.16×10³, 1,172.45×103, 129.95×10³, and 134.31×10³ (WPR, 2019), respectively. The above analysis suggests that the urban growth of megacities has slowed, and urban shrinkage has spread (Oswalt, 2005).

    International studies indicate that shrinking cities have been a widespread phenomenon (Martinez-Fernandez et al., 2012; Martinez-Fernandez et al., 2016; Mallach et al., 2017). With overall growth at the global or national level, the urban dynamic is experiencing or challenged by shrinkage at the local level (Du and Li, 2017; Li et al., 2017; Zhou et al., 2017; Deng et al., 2019; Jakar and Dunn, 2019). This implies that the seemingly contradictory urban processes of growth and shrinkage constitute the overall pattern of growing urbanization across the globe. Specifically, the two processes can coexist at a large geographic level. Moreover, shrinkage could also be concealed in rapidly urbanizing regions. For example, New York City, Chicago, Philadelphia, Detroit, Washington, Boston, and other shrinking cities are located in the increasingly metropolitan region of the Eastern United States (Oswalt, 2005; Xie et al., 2018).

    Urban shrinkage resulting from interactions among socioeconomic processes, e.g., demo-graphic shrinkage, economic globalization, deindustrialization, and suburbanization, is a major cause of urban vacant land (UVL) (Oswalt, 2005). As urban shrinkage proceeds, UVL, such as abandoned land, deserted land, and idle land, is expected to spread within the city (Németh and Langhorst, 2014; Dubeaux and Sabot, 2018; Newman et al., 2018). However, in growing cities, land is often not fully utilized. For example, vacant land often appears at the edges of rapidly growing cities (Bowman and Pagano, 2004; Ige and Atanda, 2013; Németh and Langhorst, 2014). In these cities, population density may decrease, as demographic urbanization lags behind land urbanization, accompanied by land speculation, insufficient investment, and excessive land supply. In fact, the phenomenon of land urbanization outpacing demographic urbanization is longstanding (Angel et al., 2010; Seto et al., 2011). Declining urban population density has existed for more than a century. Furthermore, declining urban population density is positively correlated with increasing income per capita (Angel, 2012). In the next 30 years, rapid urbanization is expected to take place mainly in developing countries (UN, 2014; 2019), contributing to rapid growth of per capita income, resulting in declining urban population density. This will provide the conditions for the spread of vacant land in rapidly urbanizing regions of developing countries. In sum, vacant land is expected to grow in rapidly urbanizing or shrinking regions of developing countries.

    As the largest developing country, China is experiencing rapid urbanization accompanied by increasing land scarcity. The demographic urbanization level increased from 48.34% to 59.58% with an average annual increase of 1.25% during 2009-2018 (NBSC, 2019). It could be projected that urbanization will continue to develop rapidly in the future with the implementation of national development policies, such as the Belt and Road Initiative, New Urbanization, and Beautiful China construction. However, the phenomenon of land urbanization exceeding demographic urbanization has spread from eastern China to the whole country (Tan et al., 2013; Zhu et al., 2014; Lu et al., 2016). In the last ten years, cities with a larger urban land scale showed faster land urbanization growth (Wang et al., 2012; Wang et al., 2014). As a result, urban population density in China declined, and will inevitably continue to decline in the future. Based on patterns of vacant land growth in the developed countries mentioned previously, UVL has likely spread in rapidly growing urban areas in China. Additionally, from 2000 to 2016, at least 60 cities showed shrinkage in China (Liu et al., 2019), and among these, cities in the Pearl River Delta showed remarkable shrinkage (Li et al., 2015). UVL is likely to be concealed within these shrinking cities.

    The above analysis establishes that China is a typical country experiencing both urban growth and shrinkage, making it a typical case area for UVL study. However, few studies have addressed UVL in China. According to a reference search conducted in Baidu Scholar (http://xueshu.baidu.com/) on December 10th, 2019, the limited studies in China were mainly from the field of Architecture and Landscape Science and focused on vacant land use planning and its development strategies. Therefore, the understanding of UVL remains, at best, rudimentary and subjective, especially in China.

    The aim of this paper is to present an international review of UVL in the context of growing urbanization. Based on the discussion of UVL presented in the first section, comparative analyses of the typology, morphology, distribution pattern, causes, and functions of UVL will be made. Finally, this paper presents some policy implications for the management of UVL.

    2 Methodology

    2.1 Connotation of urban vacant land

    The earliest scientific research on UVL was the master’s thesis “Problems of Vacant Land in the In-Town Area” submitted to the Department of City Planning at the Massachusetts Institute of Technology by Robert G. Emerson in 1942. The author conducted a systematic analysis of the problem of UVL in the Brighton community located in Boston. Specifically, the number, distribution, characteristics, possible impact on community social and economic welfare, causes, suitable uses, and type of vacant land were studied (Emerson, 1942). However, this thesis did not present a clear definition of UVL, and although the literature on UVL has since increased, a clear definition has yet to be formulated.

    In general, there are two representative views on the meaning of UVL to date. The first, presented by the American Planning Association, is that UVL refers to land not used for any purpose or without any buildings or other physical structures (Davidson and Dolnick, 2004). According to the second view, UVL refers to unused or abandoned land, including land that is currently unused and without any buildings, and land with buildings that have been abandoned or deserted (Accordino and Johnson, 2000; Pagano and Bowman, 2000; Németh and Langhorst, 2014; Kim et al., 2015; Kim et al., 2018). Moreover, the Chinese government established the concepts of “vacant land” and “idle land” in land management practice. The National Standard of Current Land Use Classification in China defines vacant land as a land use type referring to the unused land within an urban, village, or industrial and mining area (SAPRC, 2017). According to the Measures for the Disposal of Idle Land released in 2012, idle land is state-owned land that has been supplied for construction but has not reached the prescribed development intensity (MLRPRC, 2012).

    In the concepts compared above, vacant land is a positive term with no uniform definition, while idle land is a normative one that reveals policy intervention in land use. Here, a definition of UVL is presented from a positivism perspective. UVL is unused urban land within a developed urban area, urban planning area, or urban administrative district. Note that an unused status with no current human activity is the key criterion for designating land as UVL. UVL is not limited to land that has not been developed and constructed upon, but also includes abandoned or deserted land that has been developed with buildings, structures, and ancillary facilities. However, protective land and green infrastructure, such as parks and green spaces that are developed for recreation or landscape are excluded from UVL. Wild green spaces with no artificial management, such as wild grassland along roads or rivers within urban areas, fall within the definition of UVL.

    2.2 Measurement of urban vacant land parcel morphology

    Mean area and shape index were used to measure the morphology of UVL parcels.

    where Auvl is the mean area of UVL parcels; Suvl is the area of a UVL parcel; Nuvl is the number of UVL parcels; SIuvl is the shape index of UVL; and Puvl is the perimeter of a UVL parcel.

    2.3 Measuring method of distribution pattern of urban vacant land

    First, shares of parcel and area of UVL were used to measure the UVL occurrence probability:

    where Rp is the proportion of UVL parcel number to total land parcel number; Nuvl is the number of UVL parcels; Nlu is the total number of whole land parcels; Ra is the proportion of UVL area to total land area; Suvl is the area of UVL; and Slu is the total land area.

    Kernel density estimation, a nonparametric method that reflects the degree of spatial aggregation of observed variables by using two-dimensional smooth estimation surfaces (Xu and Gao, 2016; Liu et al., 2017), was then used to estimate UVL density.

    2.4 Data preparation

    The data used in this research include the vacancy rate of housing land in typical shrinking cities in the U.S. and UVL data in typical case cities, which are located in China, the U.S., and Canada. Sixty-five cities, including New York City, Chicago, Philadelphia, and Detroit were selected as typical cities to analyze regional differences in the vacancy rates of housing land in 2015 in the U.S. The vacancy data and urban population were taken from the World Population Review website (http://worldpopulationreview.com/). As well as the US cities listed above, the typical growing cities of Ottawa and Saskatoon in Canada, and Guangzhou in China, were also selected to analyze the distribution pattern of UVL. Vacant land data of New York City were obtained from the NYC Department of City Planning (https://www1.nyc.gov/site/planning/data-maps/open-data.page). The City of Chicago released the space coordinates of each vacant land parcel on their website (https://www.cityofchicago.org/city/en.html). We firstly mapped UVL in Chicago based on the space coordinates and then analyzed their distribution pattern. Vacant land data pertaining to Philadelphia City were obtained from the map of the percentage of vacant parcels, which were reported by the ATACANGROUP (https://www.centercityrealestate.com/philadelphia-real-estate-blog/phila-delphias-vacant-landissuses/). Vacant land data pertaining to Ottawa City were taken from the Vacant Urban Residential Land Survey and the Vacant Industrial and Business Park Lands Inventory (http://ottawa.ca/en/city-hall). Vacant land data and data pertaining to commercial and industrial businesses in Saskatoon City were taken from the Vacant Lot Inventory and the Annual Report of Businesses Information for the City of Saskatoon, which were released by the city hall (https://www.saskatoon.ca/). UVL data pertaining to Guangzhou City in Southern China were produced by the authors. Based on the connotation of UVL presented in section 2.1, a high-resolution remote sensing image, combining a street view and field survey is used to identify UVL in Guangzhou city.

    3 Results

    3.1 Urban vacant land typology

    UVL can be categorized into different types according to land cover, land usage, and land ownership. In terms of land cover, UVL in the Guangzhou case study was categorized into six types in 2016: wild grassland, abandoned building land, wild grass mixed with shrub and tree land, abandoned building mixed with bare land, bare land, and abandoned building mixed with wild grassland (Figure 1). Wild grassland, wild grass mixed with shrub and tree land, and bare land were the major types (Table 1). In Ottowa, according to the Vacant Urban Residential Land Survey and the Vacant Industrial and Business Park Lands Inventory (http://ottawa.ca/en/city-hall), UVL was categorized by land usage into vacant residential land and vacant industrial and business park land. In 2017, vacant residential land in Ottawa totaled 2,023.38 ha, with 270 parcels, while vacant industrial and business park land area totaled 810.20 ha. Vacant industrial and business park land was 63.35% privately owned and 36.65% publicly owned. Additionally, based on data from the NYC Department of City Planning (https://www1.nyc.gov/site/planning/data-maps/open-data.page), UVL in New York City was categorized into five types: private ownership, city ownership, public authority, state or federal ownership, mixed city and private ownership, and other ownership that excluded land with the above ownerships. Of these types, vacant land with private ownership was the most prevalent type in 2016 (Table 2).

    Images of urban vacant land in the case study area in Guangzhou City, China, 2016Note: The data were produced by the authors using a high-resolution remote sensing image, combining a street view and field survey (1. Wild grassland; 2. Abandoned building land; 3. Wild grass mixed with shrub and tree land; 4. Abandoned building mixed with bare land; 5. Bare land; 6. Abandoned building mixed with wild grassland).

    Figure 1.Images of urban vacant land in the case study area in Guangzhou City, China, 2016Note: The data were produced by the authors using a high-resolution remote sensing image, combining a street view and field survey (1. Wild grassland; 2. Abandoned building land; 3. Wild grass mixed with shrub and tree land; 4. Abandoned building mixed with bare land; 5. Bare land; 6. Abandoned building mixed with wild grassland).

    Number of parcelsArea of UVL (ha)Occurrence probability (%)
    Share of the number of UVL parcels to that of land parcelsShare of the area of UVL to the total land area
    Wild grassland831845.884.033.66
    Wild grass mixed with shrub and tree land319487.681.552.11
    Bare land341279.351.651.21
    Abandoned building mixed with wild grassland207201.061.000.87
    Abandoned building mixed with bare land122131.130.590.57
    Abandoned building land1210.930.060.05
    Sum18321956.028.888.46

    Table 1.

    Types of urban vacant land in the Guangzhou City case study, 2016

    Number of UVL parcelsArea of UVL (ha)Occurrence probability (%)
    Share of the number of UVL parcels to that of land parcelsShare of the area of UVL to the total land area
    Private ownership211081724.902.462.94
    City ownership4965949.440.581.62
    Public authority, state or federal ownership14038.900.020.07
    Mixed city and private ownership2652.060.000.09
    Other ownership which excludesland with the above ownerships915212.760.110.36
    Sum271542978.063.175.08

    Table 2.

    Types of urban vacant land in New York City, 2016 (Parcel, ha, %)

    3.2 Urban vacant land morphology

    New York City in the United States and Guangzhou in China were selected to study the morphology of UVL. According to vacant land data from the New York City Department of City Planning (https://www1.nyc.gov/site/planning/data-maps/open-data.page), UVL in New York City totaled 2978.06 ha with 27,154 parcels. As shown in Table 3, the mean area and average shape index value of UVL parcels were 0.11 ha and 1.46, respectively. As shown in Figure 2a, the percentage of vacant parcels less than 0.11 ha relative to the total number of vacant parcels was 88.91%. However, the area of the UVL parcels only accounted for 21.22% of the total vacant parcel area. The lowest average shape index was held by parcels between 0.035 ha and 0.10 ha, while parcels less than 0.0025 ha had the highest average shape index. With an increase in vacant parcel area, UVL parcel share, parcel area, and average shape index values first decreased sharply and then increased. Specifically, the occurrence probability of the parcels between 0.01 ha and 0.05 ha was the lowest, as these had the lowest UVL parcel share and area. However, parcels no more than 0.01 ha had the highest occurrence probability. Moreover, correlation coefficients between the average shape index and UVL parcel share and area were 0.94 and 0.93, respectively (Figure 2).

    Comparison of the morphologies of urban vacant land in the case study area in Guangzhou and New York City, 2016Note: The vacant land data pertaining to New York City were obtained from the NYC Department of City Planning (https://www1.nyc.gov/site/planning/data-maps/open-data.page); the vacant land data pertaining to Guangzhou City in southern China were produced by the authors using a high-resolution remote sensing image, combining a street view and field survey.

    Figure 2.Comparison of the morphologies of urban vacant land in the case study area in Guangzhou and New York City, 2016Note: The vacant land data pertaining to New York City were obtained from the NYC Department of City Planning (https://www1.nyc.gov/site/planning/data-maps/open-data.page); the vacant land data pertaining to Guangzhou City in southern China were produced by the authors using a high-resolution remote sensing image, combining a street view and field survey.

    DistrictsNew York CityManhattanBronxBrooklynQueensStaten Island
    Occurrence probabilityShare of the number of the vacant parcels to that of the whole city (%)3.172.724.482.452.535.65
    Share of the area of the vacant parcels to that of the whole city (%)5.082.062.972.482.5314.40
    Mean area of UVL (ha)0.110.0750.0600.0480.0730.247
    Average shape index value of UVL1.461.501.461.461.491.38

    Table 3.

    Morphologic characteristics of urban vacant land parcels in New York City, 2016

    UVL in the typical transect area of Guangzhou in 2016 was 1956.02 ha, with 1832 parcels. Table 4 shows that the mean area and average shape index value of UVL parcels were 1.07 ha and 1.39, respectively. The proportion of vacant parcels between 0.15 ha and 1.75 ha in relation to all vacant parcels was 64.03%. However, the area of the UVL parcels only accounted for 40.24% of the total vacant parcel area. Figure 2 shows that the average shape index value was between 1.29 and 2.81. Parcels between 0.15 ha and 0.75 ha had the lowest average shape index value, while parcels less than 0.02 ha had the highest. With increasing vacant parcel area, UVL parcel share and area first increased and then decreased, while the average shape index values first decreased sharply and then showed a fluctuating but overall increasing trend. Specifically, the occurrence probabilities of parcels less than 0.02 ha and more than 7.50 ha were very low due to the low UVL parcel share area. However, parcels between 1.25 ha and 1.75 ha had the highest UVL occurrence probabilities.

    DistrictNumber of UVL parcelsArea of UVL (ha)Mean area of UVL parcel (ha)Occurrence probability (%)Average shape index value
    Share of the number of the vacant parcels to that of the whole cityShare of the area of the vacant parcels to that of the whole city
    Transect 18354.170.653.752.491.45
    Transect 2144176.111.223.884.901.46
    Transect 3484597.401.2311.039.941.48
    Transect 4456536.471.1812.0910.841.37
    Transect 5413361.310.8710.199.491.31
    Transect 6252230.550.9110.068.891.27
    Total18321956.021.078.888.461.39

    Table 4.

    Morphologic characteristics of urban vacant land parcels in the typical transect area of Guangzhou City, China, 2016

    3.3 Distribution pattern of urban vacant land

    UVL distribution patterns were analyzed at inner city transect, city, and national levels. Note that the characteristics of urban expansion, industrial upgrade, and mixed land use in the Baiyun district of Guangzhou are typical in China. Moreover, airport road is the key development axis of the Baiyun district from the city core in the south to the city edge in the north. Therefore, we selected the neighborhoods along this road that are located in the designated urban planning region as the focal study area for analyzing the distribution pattern of UVL at the inner city transect level in China. To further explore the gradient characteristics of UVL, the study area was divided into six transect districts based on neighborhood, from south to north, according to economic development level (Figure 3). As shown in Table 4, the occurrence probability was between 8.46% and 8.88%. Parcel share, mean parcel area, and average shape index value first increased and then decreased as the economic development level decreased from the core city district in the south to the city’s edge in the north. Specifically, mean parcel areas in Transect Districts 2, 3, and 4 were much larger than in the other districts, while Transect Districts 1, 2, and 3 had much higher average shape index values, and Transect Districts 3 and 4 had the largest occurrence probabilities.

    Distribution pattern of urban vacant land in typical transects in Guangzhou, 2016Note: The data were produced by the authors using a high- resolution remote sensing image, combining a street view and field survey

    Figure 3.Distribution pattern of urban vacant land in typical transects in Guangzhou, 2016Note: The data were produced by the authors using a high- resolution remote sensing image, combining a street view and field survey

    At the city level, we selected New York City, Chicago, and Philadelphia in the United States, and Saskatoon in Canada, as focal cases for examining the distribution pattern of UVL. According to vacant land data released by the New York City Department of City Planning (https://www1.nyc.gov/site/planning/data-maps/open-data.page), shown previously in Table 3, the occurrence probability of UVL was between 3.17% and 5.08%. UVL in the Staten Island district, in 2016, had the highest occurrence probability, the largest parcel size, and the most regular parcel shape. However, UVL in Manhattan, the Bronx, Brooklyn, and Queens had a much lower occurrence probability and a smaller average parcel size with a more irregular shape. To further examine the distribution pattern, the regional density of UVL was estimated based on vacant parcel data using the method described in section 2.2. The results show that Staten Island had the highest concentration of UVL, while Manhattan had the most scattered and fragmented distribution, followed by the Bronx, Brooklyn, and Queens. However, each district had areas in which vacant parcels were tightly clustered. For example, the vacant parcels in the Upper East Side were much more concentrated than in the rest of Manhattan. Northeastern Brooklyn, northern and southern Queens, and southern Bronx also showed clustering of vacant parcels (Figure 4).

    Distribution pattern of urban vacant land in New York City, 2016.Note: The data were obtained from the NYC Department of City Planning (https://www1.nyc.gov/site/planning/data-maps/open-data.page).

    Figure 4.Distribution pattern of urban vacant land in New York City, 2016.Note: The data were obtained from the NYC Department of City Planning (https://www1.nyc.gov/site/planning/data-maps/open-data.page).

    The distribution of urban vacant land in Chicago was mapped using the spatial coordinates of vacant land parcels released by the City of Chicago (https://www.cityofchicago.org/city/en.html). There were 60,676 vacant lots with a density of 100 lots/km2 in Chicago in 2017. The vacant parcels in southern Chicago were highly dense, while the distribution of vacant parcels in the north and central areas of the city were scattered and clustered, respectively. To further assess the distribution pattern, the regional density of UVL was estimated based on the spatial coordinates of the vacant parcel data, again using the method described in section 2.2. Results show that the vacant parcels were clearly clustered in the western neighborhoods, such as Austin, Humboldt Park, West Garfield Park, and East Garfield Park, and the southern neighborhoods, such as West Englewood, Calumet Heights, and West Pullman (Figure 5).

    Distribution pattern of urban vacant land in Chicago, 2017Note: The space coordinates of vacant land parcels were from the City of Chicago (https://www.cityofchicago.org/city/en.html).

    Figure 5.Distribution pattern of urban vacant land in Chicago, 2017Note: The space coordinates of vacant land parcels were from the City of Chicago (https://www.cityofchicago.org/city/en.html).

    According to data from ATACANGROUP (https://www.centercityrealestate.com/philadelphia-real-estate-blog/philadelphias-vacant-landissuses/), Philadelphia had 35,575 vacant parcels in 2010 with a density of 97 lots/km2. The vacant parcels in south Philadelphia were highly dense, while the distribution of vacant parcels in the north and central areas of the city were scattered and clustered, respectively. Note that the occurrence probability of UVL was more than 20% in central city neighborhoods around Temple University (Figure 6).

    Distribution pattern of share of urban vacant land area in Philadelphia, 2010Note: The data were obtained from ATACANGROUP (https://www.centercityrealestate.com/philadelphia-real-estate-blog/philadelphias-vacant-landissuses/).

    Figure 6.Distribution pattern of share of urban vacant land area in Philadelphia, 2010Note: The data were obtained from ATACANGROUP (https://www.centercityrealestate.com/philadelphia-real-estate-blog/philadelphias-vacant-landissuses/).

    The vacant lot inventory released by Saskatoon (https://www.saskatoon.ca/) showed that there were 421 UVL parcels with a total combined area of 74.11 ha and a mean area of 0.18 ha in 2016. The distribution pattern of UVL in Saskatoon was mapped by combing the commercial and industrial businesses released by the Annual Report of Business Information for the City of Saskatoon (https://www.saskatoon.ca/) (Figure 7). Compared with the rest of Saskatoon, the central city had a greater density of vacant parcels with a smaller mean area. The share of the number of vacant parcels in central city neighborhoods—such as the Airport Business Area, Caswell Hill, the Central Business District, Central Industrial, City Park, Kelsey-Woodlawn, Mayfair, North Industrial, and Riversdale—in relation to the city as a whole was 53.92%. However, the mean area of the vacant parcels in these neighborhoods was only 0.10 ha.

    Distribution pattern of urban vacant land in Saskatoon, Canada, 2016Note: “Density” denotes the density of urban vacant land parcel; “economic density” denotes the density of commercial and industrial businesses at the neighborhood level. Vacant land data and data of commercial and industrial businesses were taken from the Vacant Lot Inventory and the Annual Report of Businesses Information for the City of Saskatoon, which were released by the city hall (https://www.saskatoon.ca/).

    Figure 7.Distribution pattern of urban vacant land in Saskatoon, Canada, 2016Note: “Density” denotes the density of urban vacant land parcel; “economic density” denotes the density of commercial and industrial businesses at the neighborhood level. Vacant land data and data of commercial and industrial businesses were taken from the Vacant Lot Inventory and the Annual Report of Businesses Information for the City of Saskatoon, which were released by the city hall (https://www.saskatoon.ca/).

    The distribution pattern of residential land vacancy rates at the national level was examined using data from 65 U.S. cities, including New York City, Chicago, Philadelphia, and Detroit. Vacancy rate distributions were mapped using the cities’ residential and urban population data found on the World Population Review website (http://worl-dpopulationreview.com/). As shown in Figure 8, the 2015 vacancy rates of the cities in the north and east were higher, while the rates of the cities in the south and west were lower. The average vacancy rate for the 65 cities was 11.48%. The number of cities with a residential land vacancy rate higher than 10% and 20% was 36 and 4, respectively. The vacancy rate in Detroit was 30%, the highest rate of the 65 cities.

    Distribution pattern of urban vacant housing land in 65 cities, U.S., 2015

    Figure 8.Distribution pattern of urban vacant housing land in 65 cities, U.S., 2015

    3.4 Proximate causes for urban vacant land

    3.4.1 Excessive land division

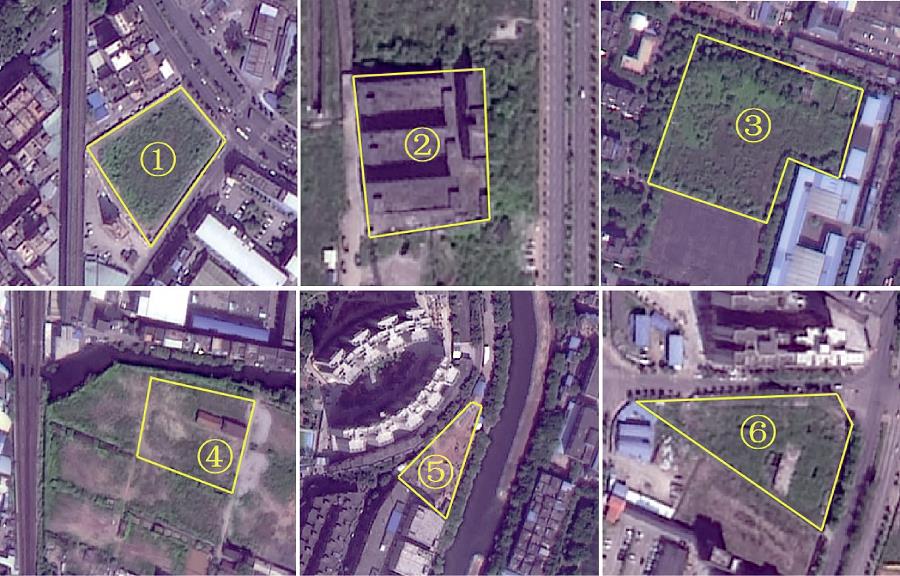
    To maximize land return when land is scarce, land parcels are often divided into several lots for different users. As demand grows, the divided parcels are inclined to be abandoned or deserted because it is difficult to achieve sufficient economy of scale. For example, the size of urban vacant land plots in New York City is significantly smaller than in Guangzhou (Figure 2). In Guangzhou, the mean area of vacant land parcels in Transect District 1 is remarkably smaller than that of the other transect districts. The industrial and commercial density in the central blocks of Saskatoon is also significantly higher than in other regions of the city, with greater land scarcity and a lower mean area of vacant land parcels in these neighborhoods, as compared to others (Figure 7). Additionally, in New York City, the occurrence probability of UVL was between 80.20% and 83.73% for land parcels below 0.0025 ha, and between 18.99% and 23.18% for land parcels falling between 0.0025 ha and 0.01 ha.

    3.4.2 Irregularly shaped land parcel

    Irregular shape often leads to inefficient urban land use and further results in UVL. For example, as shown in Figure 2, the average shape index values of the parcels in New York City and the typical transect area of Guangzhou are both greater than 1.50. The average shape index of parcels in New York City is much greater than in Guangzhou city, however. For New York City, the correlation coefficients for UVL parcel share and average parcel shape index, and UVL area and parcel shape index, are 0.93 and 0.94, respectively. Moreover, UVL parcels smaller than 0.0025 ha have the highest occurrence probability, with an average shape index of 2.95.

    3.4.3 Decreasing resident population and deindustrialization

    Urban shrinkage is often characterized by decreasing resident population, industry degradation, and industry out-migration (Oswalt, 2005; Martinez-Fernandez et al., 2012), all of which may cause UVL. As shown in Figure 8, the U.S. cities with obvious population shrinkage also have remarkably higher residential land vacancy rates. For example, the urban population in Detroit decreased by 1.17 million between 1950 and 2015, while the residential land vacancy rate reached 30%. During this time, the urban population in Cleveland and St. Louis decreased by 0.53 million and 0.54 million, respectively, while the residential land vacancy rates reached 21.20% and 20.50%. In Chicago, the urban population decreased by 0.90 million, and the residential land vacancy rate reached 13.20%. For New York City, a dramatic decrease in urban population occurred, together with an increase in concentrated vacant residential land in the Upper East Side of Manhattan. New York City has typical industrial areas, such as northeastern Brooklyn, north and south Queens, and the southern part of the Bronx. With the development of deindustrialization, vacant residential land greatly increased in these regions (Figure 4). Philadelphia’s central area around Temple University is a typical deindustrialized region that experienced a large decrease in population. The residential land vacancy rate in central Philadelphia was over 20%. Note that cities in the Great Lakes region and Mid-Atlantic region are also typical deindustrialized U.S. cities with high residential land vacancy rates. Deindustrialized regions are also found in Guangzhou, such as Transect Districts 3 and 4. These districts have much higher residential vacancy rates than other transect districts.

    3.4.4 Land speculation, insufficient investment, and environmental concerns

    UVL led by land speculation has been reported in European and U.S. cities (Németh and Langhorst, 2014; Crowe and Foley, 2017). Two types of land speculation have also been found in Guangzhou. The first type is land that has been granted but not supplied, land approved to be converted from agricultural to urban land, which remains idle while the government waits for land prices to rise before supplying the land. Another type is land that has been supplied but is unused, supplied and attained by land users, but not used due to their hoarding the land. Insufficient investment could result directly in the suspension of ongoing construction or the failure of a construction project. In Guangzhou, several land parcels were attained by land users but not used because of capital shortage. Similar cases have also been reported in European and U.S. cities (Németh and Langhorst, 2014; Newman et al., 2016a; 2016b; Crowe and Foley, 2017; Xie et al., 2018). Contaminated urban land, such as brownfield identified in North American cities, was often discarded or abandoned. In addition, several land parcels were vacant due to problems, such as steep slope and landslide hazard.

    3.5 Impacts of urban vacant land

    UVL has been a gray area of urban social, economic, and ecological space. Urban social space is the communication space formed by population gathering and movement. However, urban social spaces are often separated by UVL. Specifically, UVL is often located along roads, corridors, and overpasses or concealed among dwellings and commercial and industrial areas. Most UVL is obstructed or covered by trees, shrubs, weeds, or abandoned buildings, providing cover for criminal activity, such as rape, robbery, murder, and illicit disposal of corpses (Accordino and Johnson, 2000; PACDC, 2010; Branas et al., 2011). In recent years, there have been frequent reports of criminal activity on urban vacant lands in China. This implies that UVL is a gray area of urban social space.

    Urban economic space is a carrier for economic activity formed by the aggregation, flow, and allocation of urban production factors. For a growing city with increasing land scarcity, UVL is undoubtedly a significant waste of urban economic space. Moreover, UVL often exerts a negative impact on economic growth by restricting the expansion of urban economic space, distribution optimization, and improvements in scale efficiency (Newman et al., 2016a; 2016b). In addition, UVL significantly reduces the value of surrounding residences. For example, UVL in central Philadelphia led to declines of 14% to 20% in the value of surrounding residential properties (EC, 2010; Branas et al., 2011). This implies that UVL is a gray area of urban economic space.

    Urban ecological space is an organic system composed of ecological elements, such as forests, parks and green spaces, rivers, and lakes. This space provides important ecological functions, such as climate regulation, environmental purification, and hydrological regulation. However, these ecological functions are considerably suppressed by UVL (Schwarz et al., 2018). For example, UVL is often covered by garbage in the Guangzhou case study area, contributing to the spread of harmful species and germs. Although some parcels of UVL are covered by bare soil, weeds, shrubs, and even trees, their ecological benefits have been largely lost due to lack of management. Furthermore, serious ecological problems, such as pollution (e.g., brownfields) and soil erosion, have occurred on UVLs. Vacant land is also, therefore, a gray area of urban ecological space.

    3.6 Multiple functions of urban vacant land

    Revitalizing urban vacant land is conducive to alleviating urban land shortages. It is also an important resource for urban economic development, and could produce direct economic returns through residential and commercial real estate development (Accordino and Johnson, 2000; Li et al., 2017). The reuse or transformation of UVL along roads, corridors, and overpasses, or within residential, commercial, and industrial areas, could reduce crimes such as rape, robbery, murder, and the illicit disposal of corpses. UVL could be transformed into green infrastructures for improving ecological functions, such as habitats, biological control, climate regulation, carbon sequestration, air purification, and rainwater infiltration (PACDC, 2010; Anderson and Minor, 2019). Moreover, urban agriculture, community parks, resident-led beautification, and small creative enterprises could be developed on UVLs, which would enhance community harmony and vitality (Németh and Langhorst, 2014; Carlet et al., 2017; Stewart et al., 2019). In conclusion, UVL has multiple uses and is a potential resource for urban sustainability (Pagano and Bowman, 2000; Burkholder, 2012; Kim et al., 2015; Kim, 2016; Kim et al., 2016a; 2016b; Kobayashi and Ikaruga, 2016; Crowe and Foley, 2017; Kim et al., 2018).

    4 Policy implications for urban vacant land management

    4.1 Considering urban vacant land transition in urban renewal

    This study indicates that UVL can occur in the core or at the edge of a city, whether the city is growing or shrinking. Although UVL exerts serious impacts on urban development, it is also a potential resource for enhancing urban sustainability. Urbanization is, in essence, a process of continuous urban renewal. However, current urban renewal focuses only on the redevelopment of older city areas, older industrial areas, and inefficient urban lands, and ignores widespread UVL. It is imperative to integrate UVL into the goal system of urban renewal and to promote urban renewal by unifying urban social, economic, and ecological spaces.

    4.2 Improving land division to reduce urban land fragmentation

    Land parcels should be carefully and rationally divided during the land supply stage. Close attention should be paid to the parcel size threshold to maximally reduce shape irregularity and fragmented parcels. As shown previously in Figure 2, in New York City, parcels less than 0.01 ha had a much higher occurrence probability of UVL. Moreover, the more irregularly shaped parcels had a higher probability of becoming vacant land. In 2016, parcel areas between 0.20 and 3.0 ha accounted for 87.49% of the total land area.

    In Guangzhou, land division is much lower than in New York City, and parcel shape is less regular. With increasing land scarcity, the municipal government of Guangzhou is expected to increase land division to earn more land returns. Given the patterns in New York City, Guangzhou should pay close attention to the parcel size thresholds between 0.01 ha and 0.02 ha in determining future land supply.

    4.3 Emphasizing assessment of land capacity for economic activity in land supply

    The results described in section 3.3 indicate that the occurrence probability and mean area of UVL were much higher in Transect Districts 3 and 4 than in the other transect districts in the Guangzhou case study area. As shown previously in Figure 2, the parcels of 1.25 ha had the highest UVL occurrence probability. Field surveys show that UVLs of this size are mostly caused by the relocation of industrial enterprises, and that several enterprises in outdated industries left due to the government’s strategy of industrial upgrading and increasing labor costs. Other enterprises moved from limited land that could not support future development. Specifically, enterprises can initially acquire only small-scale land due to their limited capital. With further development, they often cannot expand their land scale due to increasing urban land scarcity and the complicated land use tenure inherent to economic activity.

    4.4 Strengthening urban land use supervision

    At present, the Chinese central government has yet to carry out a survey of UVL. Although the government released the Measures for the Disposal of Idle Land in 2012, idle land has seldom been surveyed and monitored. As a result, there is no reliable database of UVL in China. Considering the high variability of UVL, it is recommended that the government should conduct a special survey of UVL on a quarterly basis and publish a list of UVLs at the end of each quarter. Based on the survey information, strict supervision of UVL could be implemented. Additionally, considering the close relationship between urban shrinkage and UVL, the government should strengthen the monitoring of socioeconomic development information, such as residential population and industrial space changes to allow for early signaling and detection of urban shrinkage in dense urban districts.

    4.5 Revitalizing urban vacant land and deepening the structural reform of urban land supply

    Differential transformation of UVL should be promoted based on multifunctional land use assessment, which is conducted with the goal of unifying the development of urban social, economic, and ecological spaces. It is advisable to promote the transformation of UVL with economic development value into commercial residences, affordable housing, commercial services and industries, and urban farms through land replacement and integration. Social capital should be used to promote the transformation of UVL with low economic development value but high social-ecological value into community green space and parks, cultural and sports facilities, and sightseeing destinations. In addition, to improve the level of intensive land use and promote the smart growth of urban areas, a system of temporary development and utilization of UVL could be implemented (Németh and Langhorst, 2014). For example, UVL with sealed soil could be converted to temporary public parking lots and soilless urban farms, while UVL with fertile soil could be converted to temporary urban agricultural parks and urban farms.

    5 Conclusions

    Urban growth has been pursued since the rapid global urbanization of the 1960s, yet patterns from European and U.S. cities show that urban shrinkage has been increasing. In fact, the seemingly contradictory urban processes of growth and shrinkage constitute the overall pattern of growing urbanization worldwide. Inefficient land use, resulting in vacant land, has long been concealed within urban areas. However, UVL has seldom received attention from geographers. Moreover, prior studies of the typology, morphology, proximate causes, and multiple functions of UVL have been rudimentary and subjective. Based on bibliometric analysis, UVL can be defined as unused land within urban areas, and can be distinguished by the key feature of being unused with no current human activity. UVL is, therefore, land that has not been developed or constructed upon, as well as abandoned or deserted land with buildings, structures, and ancillary facilities. However, protective land and green infrastructure, such as parks and green spaces developed for recreation or providing landscape, are excluded from UVL. Based on an international comparative study of Guangzhou in China, Ottawa and Saskatoon in Canada, and 65 typical shrinking cities in the United States, UVL was categorized using three dimensions: land cover, land use, and land tenure. UVL was found to be widely distributed with an overall fragmented pattern, small size, and irregular shape. The distribution pattern differs visibly at inner city transect, city, and national levels. The proximate causes for UVL include irrational land division, irregularly shaped land parcels, decreasing resident population, deindustrialization, land speculation, insufficient investment, and environmental concerns. In general, UVL has become a gray area of urban social, economic, and ecological space. However, it is also a potential resource with multiple functions for enhancing urban sustainability. To promote urban sustainability, policies on the monitoring, control, and differential revitalization of UVL should be emphasized.

    References

    [1] J Accordino, T Johnson G. Addressing the vacant and abandoned property problem. Journal of Urban Affairs, 22, 301-315(2000).

    [2] C Anderson E, S Minor E. Assessing social and biophysical drivers of spontaneous plant diversity and structure in urban vacant lots. Science of The Total Environment, 653, 1272-1281(2019).

    [3] S Angel. Planet of Cities. Lincoln Institute of Land Policy(2012).

    [4] S Angel, J Parent, D Civco et al. A planet of cities: Urban land cover estimates and projections for all countries, 2000-2050.. Lincoln Institute of Land Policy Working Paper.(2010).

    [5] (2019). https://www.centercityrealestate.com/philadelphia-real-estate-blog/philadelphias-vacant-landissuses/

    [6] M Bowman A O, A Pagano M. Terra Incognita: Vacant Land and Urban Strategies(2004).

    [7] C Branas C, A Cheney R, M Macdonald J et al. A difference-in-differences analysis of health, safety, and greening vacant urban space. American Journal of Epidemiology, 174, 1296-1306(2011).

    [8] S Burkholder. The new ecology of vacancy: Rethinking land use in shrinking cities. Sustainability, 4, 1154-1172(2012).

    [9] F Carlet, J Schilling, M Heckert et al. Legacy cities: Urban agriculture as a strategy for reclaiming vacant land. Agroecology & Sustainable Food Systems, 3, 1-20(2017).

    [10] (2019). https://www.cityofchicago.org/city/en.html

    [11] (2019). http://ottawa.ca/en/city-hall

    [12] (2019). https://www.saskatoon.ca/

    [13] R Crowe P, K Foley. Exploring urban resilience in practice: A century of vacant sites mapping in Dublin, Edinburgh and Philadelphia. Journal of Urban Design, 22, 208-228(2017).

    [14] M Davidson, F Dolnick. A planner’s dictionary. Planning Advisory Service Report Number 521/522.. Chicago, IL: American Planning Association.(2004).

    [15] T Deng T, D Wang D, Y Yang et al. Shrinking cities in growing China: Did high speed rail further aggravate urban shrinkage?. Cities, 86, 210-219(2019).

    [16] W Du Z, X Li. Growth or shrinkage: New phenomena of regional development in the rapidly-urbanising Pearl River Delta. Acta Geographica Sinica, 72, 1800-1811(2017).

    [17] S Dubeaux, C Sabot E. Maximizing the potential of vacant spaces within shrinking cities, a German approach. Cities, 75, 6-11(2018).

    [18] Vacant Land Management in Philadelphia: The Costs of the Current System and the Benefits of Reform(2010).

    [19] G Emerson R. Problems of vacant land in the in-town area. B A. Dartmouth College.(1942).

    [20] http://data.worldbank.org.cn/indicator

    [21] O Ige J, A Atanda T. Urban vacant land and spatial chaos in Ogbomoso North local government, Oyo State, Nigeria. Global Journal of Human-Social Science (B): Geography, Geo-Sciences Environmental Science & Disaster Management, 13, 29-36(2013).

    [22] S Jakar G, J R Dunn. (Turning Rust into Gold?) Hamilton, Ontario and a Canadian perspective of shrinking and declining cities. Cities, 94, 1-10(2019).

    [23] L Jiang, O Neill B C. Global urbanization projections for the shared socioeconomic pathways. Global Environmental Change, 42, 193-199(2017).

    [24] G Kim. The public value of urban vacant land: Social responses and ecological value. Sustainability, 8, 486(2016).

    [25] G Kim, A Miller P, J Nowak D. Assessing urban vacant land ecosystem services: Urban vacant land as green infrastructure in the city of Roanoke, Virginia. Urban Forestry & Urban Greening, 14, 519-526(2015).

    [26] G Kim, A Miller P, J Nowak D. The value of green infrastructure on vacant and residential land in Roanoke, Virginia. Sustainability, 8, 296(2016).

    [27] G Kim, A Miller P, J Nowak D. Urban vacant land typology: A tool for managing urban vacant land. Sustainable Cities and Society, 36, 144-156(2018).

    [28] T Kobayashi, S Ikaruga. Occurrence factors of large vacant lots in central districts and their utilization by local governments in Japan. Frontiers of Architectural Research, 5, 393-402(2016).

    [29] X Li, W Du Z, F Li X. The spatial distribution and mechanism of city shrinkage in the Pearl River Delta. Modern Urban Research, 36-43(2015).

    [30] X Li, K Wu, Y Long et al. Academic debates upon shrinking cities in China for sustainable development. Geographical Research, 36, 1997-2016(2017).

    [31] W Liu G, Y Xie F, K Hong J et al. Urban shrinkage in China based on the data of population and economy. Economic Geography, 39, 50-57(2019).

    [32] L Liu, X Zhang C, X Feng J et al. The spatial-temporal distribution and influencing factors of fraud crime in ZG city, China. Acta Geographica Sinica, 72, 315-328(2017).

    [33] Z Liu, C He, Y Zhou et al. How much of the world’s land has been urbanized, really? A hierarchical framework for avoiding confusion. Landscape Ecology, 29, 763-771(2014).

    [34] Q Lu Z, S Qing S, Rui Deng et al. Coordination of demographic urbanization and land urbanization in China. Urban Problems, 6, 33-38(2016).

    [35] A Mallach, A Haase, K Hattori. The shrinking city in comparative perspective: Contrasting dynamics and responses to urban shrinkage. Cities, 69, 102-108(2017).

    [36] C Martinez-Fernandez, I Audirac, S Fol et al. Shrinking cities: Urban challenges of globalization. International Journal of Urban & Regional Research, 36, 213-225(2012).

    [37] C Martinez-Fernandez, T Weyman, S Fol et al. Shrinking cities in Australia, Japan, Europe and the USA: From a global process to local policy responses. Progress in Planning, 105, 1-48(2016).

    [38] Regulation on Idle Land Disposal(2012).

    [39] . China Statistical Yearbook 2018.(2019).

    [40] G Newman, O Bowman A, J Lee R et al. A current inventory of vacant urban land in America. Journal of Urban Design, 21, 302-319(2016).

    [41] G Newman, D Gu, H Kim J et al. Elasticity and urban vacancy: A longitudinal comparison of U.S. cities. Cities, 58, 143-151(2016).

    [42] G Newman, Y Park, O Bowman A et al. Vacant urban areas: Causes and interconnected factors. Cities, 72, 421-429(2018).

    [43] J Németh, J Langhorst. Rethinking urban transformation: Temporary uses for vacant land. Cities, 40, 143-150(2014).

    [44] (2019). https://opendata.cityofnewyork.us/data/

    [45] P Oswalt. Shrinking Cities: Volume 1: International Research.. Ostfildern-Ruit, Germany: Hatje Cantz Verlag.(2005).

    [46] A Pagano M, O Bowman A. Vacant Land in Cities: An Urban Resource.. Brookings Institution, Center on Urban and Metropolitan Policy.(2000).

    [47] Vacant Land Management in Philadelphia: The Costs of the Current System and the Benefits of Reform(2010).

    [48] K Schwarz, A Berland, L Herrmann D. Green, but not just? Rethinking environmental justice indicators in shrinking cities. Sustainable Cities and Society, 41, 816-821(2018).

    [49] C Seto K, F Michail, G Burak et al. A meta-analysis of global urban land expansion. Plos One, 6, e23777(2011).

    [50] Current Land Use Classification. GBT 21010-2017(2017).

    [51] P Stewart W, H Gobster P, A Rigolon et al. Resident-led beautification of vacant lots that connects place to community. Landscape and Urban Planning, 185, 200-209(2019).

    [52] K Tan S, P Song H. Match situation of land urbanization rate and demographic urbanization in China. Urban Problems, 11, 2-6(2013).

    [53] World Urbanization Prospects: The 2014 Revision, Highlights(2014).

    [54] World Urbanization Prospects: The 2018 Revision, Highlights(2019).

    [55] L Wang, C Li C, Q Ying et al. China’s urban expansion from 1990 to 2010 determined with satellite remote sensing. Chinese Science Bulletin, 57, 1388-1399(2012).

    [56] Y Wang, J Wang S, J Qin. Spatial evaluation of land urbanization level and process in Chinese cities. Geographical Research, 33, 2228-2238(2014).

    [57] (2019). http://worldpopulationreview.com/us-cities/

    [58] C Xie Y, M Gong H, H Lan et al. Examining shrinking city of Detroit in the context of socio-spatial inequalities. Landscape and Urban Planning, 177, 350-361(2018).

    [59] N Xu Z, L Gao X. A novel method for identifying the boundary of urban built-up areas with POI data. Acta Geographica Sinica, 71, 928-939(2016).

    [60] K Zhou, F Qian F, Y Yan. A multi-scaled analysis of the “Shrinking Map” of the population in Hunan province. Geographical Research, 36, 267-280(2017).

    [61] K Zhu F, R Zhang F, C Li et al. Coordination and regional difference of urban land expansion and demographic urbanization in China during 1993-2008. Progress in Geography, 33, 647-656(2014).

    Xiaoqing SONG, Mengmeng WEN, Yajing SHEN, Qi FENG, Jingwei XIANG, Weina ZHANG, Guosong ZHAO, Zhifeng WU. Urban vacant land in growing urbanization: An international review[J]. Journal of Geographical Sciences, 2020, 30(4): 669
    Download Citation