• High Power Laser Science and Engineering
  • Vol. 11, Issue 3, 03000e42 (2023)
A. Praßelsperger*, F. Balling, H.-P. Wieser, K. Parodi, and J. Schreiber
Author Affiliations
  • Fakultät für Physik, Ludwig-Maximilians-Universität München, Garching, Germany
  • show less
    DOI: 10.1017/hpl.2023.18 Cite this Article Set citation alerts
    A. Praßelsperger, F. Balling, H.-P. Wieser, K. Parodi, J. Schreiber. Ion-bunch energy acoustic tracing by modulation of the depth-dose curve[J]. High Power Laser Science and Engineering, 2023, 11(3): 03000e42 Copy Citation Text show less

    Abstract

    Characterizing exact energy density distributions for laser-accelerated ion bunches in a medium is challenging due to very high beam intensities and the electro-magnetic pulse emitted in the laser–plasma interaction. Ion-bunch energy acoustic tracing allows for reconstructing the spatial energy density from the ionoacoustic wave generated upon impact in water. We have extended this approach to tracing ionoacoustic modulations of broad energy distributions by introducing thin foils in the water reservoir to shape the acoustic waves at distinct points along the depth–dose curve. Here, we present first simulation studies of this new detector and reconstruction approach, which provides an online read-out of the deposited energy with depth within the centimeter range behind the ion source of state-of-the-art laser–plasma-based accelerators.

    1 Introduction

    Since the advent of laser-ion acceleration in 2000, the field has been steadily progressing[14]. While previously ions were accelerated predominantly by target normal sheath acceleration (TNSA) to up to tens of MeV, state-of-the-art PW systems with improved temporal laser contrast reach new acceleration regimes. As such, radiation pressure acceleration and relativistic-induced transparency accelerate ions within sub-ps laser–plasma interactions, resulting in pronounced angular emission characteristics[5]. At these acceleration parameters, protons approaching the 100 MeV kinetic energy barrier as well as carbon ions exceeding 80 MeV/u have been observed[68]. With improving parameters of this technique, the number of applications is increasing steadily. As such, the first radio-biological in vivo studies of tumor irradiation with laser-accelerated ions investigating the FLASH effect have been conducted[9], fundamental ion–matter interactions in high-energy deposition regions have been investigated[1012] and the application of laser-accelerated ion bunches for fuel ignition in inertial confinement fusion has been discussed[1315]. All of these applications require a precise ion spectrum determination for depth–dose verification, model input and cross-section maximization. Peak beam currents exceeding mega-amperes pose challenges to detectors applied for spectral measurements[16]. The harsh conditions encountered, especially in the aperture angle close to the laser–plasma interaction where strong electro-magnetic pulses (EMPs) disturb (or even damage) electronics, prevent the application of complementary metal oxide semiconductor (CMOS) detectors, such as RadEyes[17,18]. On the other hand, when measuring further downstream of the laser–plasma interaction as, for example, done by Thomson parabolas, angular emission features such as energy-dependent cone narrowing are forfeited[19,20]. Other non-invasive detection modalities, such as integrating current transformers, measure the total beam charge without a precise spectrum reconstruction[21]. Due to these issues, non-electronic methods such as radio chromic films (RCFs) or Columbia Resin #39 (CR39) are still utilized as widespread standard ion diagnostics in laser-ion-acceleration experiments[22,23]. They suffer from none of the discussed drawbacks, but nevertheless they do not allow for online read-out. Particularly for highly energetic particles exceeding 100 MeV, the RCF stacks used in experiments can become quite thick and evaluation is tedious.

    A rather new approach for energy density determination of laser-accelerated particles is ionoacoustics[24]. It capitalizes on the measurement of the ultrasound wave emitted by the heat-expansion of a medium when energy is deposited by ions in a short amount of time[25,26]. The pressure trace $p\left({\mathit{\boldsymbol r}},t\right)$ at an ultrasonic transducer at position $\mathit{\boldsymbol r}$ , emerging from an arbitrary dose distribution $H\left(\mathit{\boldsymbol r}^{\prime },t\right)$ , can be described by the following:

    $$\begin{align}p\left(\mathit{\boldsymbol r},t\right)=\frac{N_\mathrm{p}}{4\pi}\frac{\Gamma}{c_\mathrm{s}^2}\frac{\partial }{\partial t}\int \mathrm{d}\mathit{\boldsymbol r}^{\prime}\frac{1}{\mid \mathit{\boldsymbol r}-\mathit{\boldsymbol r}^{\prime}\mid }H\left(\mathit{\boldsymbol r}^{\prime },t-\frac{\mid \mathit{\boldsymbol r}-\mathit{\boldsymbol r}^{\prime}\mid }{c_\mathrm{s}}\right),\end{align}$$  

    where ${N}_\mathrm{p}$ describes the number of ions and $\Gamma$ and ${c}_\mathrm{s}$ represent the medium’s Grüneinsen parameter and speed of sound, respectively. The retarded time $t\ -\mid \mathit{\boldsymbol r}-\mathit{\boldsymbol r}^{\prime}\mid /{c}_\mathrm{s}$ is used to denote a signal propagation time from its source to the detector. For laser acceleration, the sub-ps ion-bunch duration behind the laser target causes an energy deposition time-scale much faster than the thermal energy transport (heat confinement) and the volumetric expansion (stress confinement) of the medium due to the temperature increase. As a result, the thermo-acoustic approximation can be used to describe the temporal function of the dose distribution by a delta-function $\delta (t)$ , that is, $H\left(\mathit{\boldsymbol r}^{\prime },t\right)={H}_\mathrm{s}\left(\mathit{\boldsymbol r}^{\prime}\right)\delta (t)$ , simplifying the far-field term of H to be proportional to the spatial derivative of the dose distribution ${\nabla}_\mathrm{r}{H}_\mathrm{s}\left(\mathit{\boldsymbol r}\right)$ .

    The ion-bunch energy acoustic tracing (I-BEAT) detector measures this far-field pressure trace on a single-shot to reconstruct the initial energy deposition and the corresponding particle spectrum down to a minimum of ${10}^7$ protons/mm2 per bunch[27]. The advantages of this method are, firstly, the EMP resistance as the pressure wave has a μs delay to the EMP when arriving at the ultrasound detector. The detector is a piezoelectric PZT-transducer with a saturation threshold orders of magnitude above the capabilities of modern laser accelerators. Secondly, as radiation damage or decay in water is negligible, it is radiation resistant in terms of re-usability. Further, water shows a low acoustic attenuation, allowing one to detect signals nearly unperturbed.

    Demonstrated by several experiments, this ionoacoustic approach is also capable of detecting mono-energetic bunches of 20 MeV protons down to minimum energy deposition of ${10}^{12}$ eV, equivalent to a particle number of $5\times$ ${10}^4$ with an accuracy in the range verification of $\pm 30\;\unicode{x3bc}$ m[28]. Similarly, 1H, 238U, 124Xe and 12C ions in excess of hundreds of MeV/u kinetic energies were characterized and applicability up to 1 GeV was proposed[29,30]. Applying multiple transducers, it has been shown that ionoacoustic tomography of the ion beam’s Bragg-peak profile is possible in vivo and in real-time, with sub-mm accuracy[31].

    Adversely, the inherent drawback of this method is the reliance on a spatial energy density gradient to produce the pressure amplitude. This gradient is induced by the Bragg-peak for mono-energetic ion beams. Laser-accelerated ion beams, however, typically exhibit an exponential ion energy spectrum with certain additional features, depending on the acceleration regime[1,5,7]. These spectra range over orders of magnitude and the corresponding energy densities deposited in matter are typically dominated by the low-energy particles. Therefore, the dynamic range of ionoacoustic measurements often is insufficient to measure and reconstruct the entire spectrum and is sensitive only to their low-energetic components[27,32].

    Here we present a simulation study of a new version of I-BEAT, solving this problem by artificially introducing gradients to the energy density distribution, that is, tracing ionoacoustic modulations of broad energy distributions (TIMBRE). The detector is designed to be placed within a few centimeter range behind the target to collect the majority of the accelerated particles. Similar to the spherical ionoacoustic waves with resonant frequency (SPIRE) technique[33,34], we use special modulator foils to increase the electronic stopping power of the ions. This generates high-energy density gradients at the water–modulator interfaces and, hence, strong broadband frequency signals. In addition, placing the modulator foils equidistantly results in particularly strong resonant waves, allowing for reconstruction of the energy deposited in the modulator foils. This overcomes theoretical predictions of minimum detection thresholds of the Bragg-peak, given that media interfaces are spatially more pronounced in their electronic stopping gradients[35].

    2 Detector concept

    2.1 Modulator foils

    Figure 1(a) shows a cross-section scheme of the detector. It consists of a vacuum-compatible water tank that is placed within the centimeter range behind the laser target to collect most of the accelerated ions. A Kapton entrance window is used for the ions to enter the water volume. Inside the tank, multiple flat foils act as modulators to shape the dose distribution. By this method, spatially separated energy density distribution characteristics are encoded in the acoustic source signal. To find an optimal modulator material four quantities were optimized. First, the ion stopping power in the modulators should be high compared with water to generate large energy density gradients at the interfaces. Second, the modulator’s Grüneisen parameter $\Gamma$ (see Equation (1)), which defines the material’s property to translate a certain energy density into pressure, should be high to further increase the instantaneous pressure ${p}_0\equiv p\left(\mathit{\boldsymbol r},0\right)$ . Third, the acoustic impedance of the material ${z}_\mathrm{mod}$ needs to be matched to water, given that the reflectivity $R$ of a pressure wave is given by $R=\left({z}_\mathrm{w}-{z}_\mathrm{mod}\right)/\left({z}_\mathrm{w}+{z}_\mathrm{mod}\right)$ , where ${z}_\mathrm{w}$ is the water impedance ( $z=\rho {c}_\mathrm{s}$ ). Thus, pressure signals that have to percolate subsequent foils to propagate to the transducer are transmitted without extensive reflection of their energy content. Lastly, the speed of sound of the material should be as low as possible to keep generated frequencies $f$ low, because higher ones are attenuated more strongly in water, which shows a quadratic acoustic attenuation of $0.0022\;\mathrm{dB}\cdot\mathrm{cm}^{-1}\cdot{\mathrm{MHz}}^{-2}$ . Here, lead was found to show the best trade-off between all four conditions due to its balance among the speed of sound ${c}_\mathrm{s}$ , density $\rho$ and electronic stopping. The initial pressure in the lead modulators ( ${p}_{0,\mathit{\operatorname{mod}}}$ ) is more than two orders of magnitude higher than in water ( ${p}_{0,\mathrm{w}}$ ), that is, ${p}_{0,\mathit{\operatorname{mod}}}\approx 256\times {p}_{0,\mathrm{w}}$ , resulting from increased electronic stopping and a higher Grüneisen parameter, whilst the reflectivity $R$ at the interfaces is approximately 87%. Figure 1(b) shows a representative simulated depth–dose distribution for the reference case with 10 modulator foils and an input proton spectrum as accelerated by the petawatt high-energy laser for heavy ion experiments (PHELIX) laser at the GSI Helmholtzzentrum für Schwerionenforschung[32].

    (a) Schematic image of the new I-BEAT detector. It is placed within the centimeter range behind the laser target to capture most of the accelerated ions (shielding not shown). The ions deposit their energy along their propagation path until they stop within the water tank. In the lead modulator foils their electronic stopping power is increased to generate sharp energy density gradients. An exemplary integrated energy density curve versus depth for this setting is given in (b). Here a reference spectrum was used to simulate the 3D deposited energy distribution and, subsequently, the central x–z-plane was integrated along x to generate an axial (z) plot. The stopping power ratio of the lead modulators compared with water is approximately 8.9.

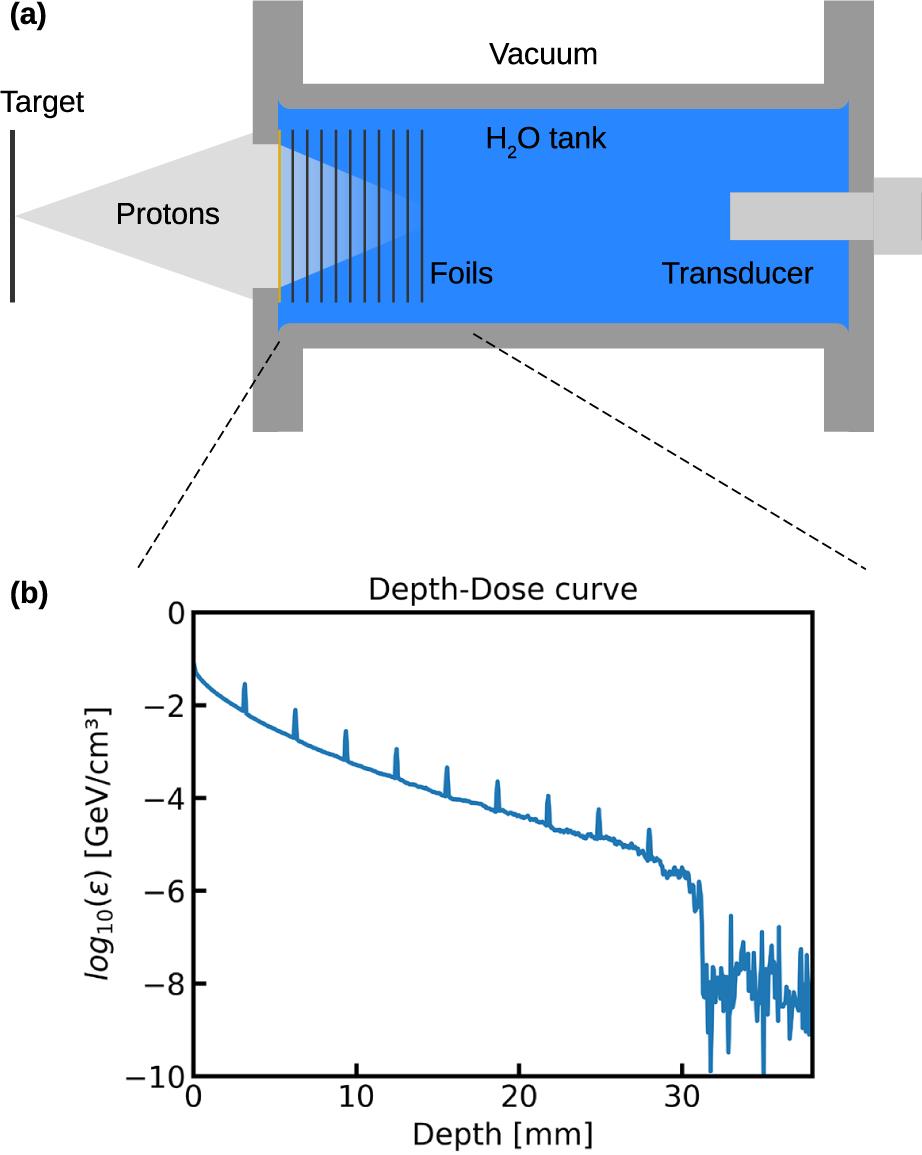
    Figure 1.(a) Schematic image of the new I-BEAT detector. It is placed within the centimeter range behind the laser target to capture most of the accelerated ions (shielding not shown). The ions deposit their energy along their propagation path until they stop within the water tank. In the lead modulator foils their electronic stopping power is increased to generate sharp energy density gradients. An exemplary integrated energy density curve versus depth for this setting is given in (b). Here a reference spectrum was used to simulate the 3D deposited energy distribution and, subsequently, the central xz-plane was integrated along x to generate an axial (z) plot. The stopping power ratio of the lead modulators compared with water is approximately 8.9.

    2.2 Signal generation and propagation

    In Figure 2, the process of the pressure wave generation is shown. The initial pressure has a step gradient at the modulator interfaces, which comes with a wide frequency bandwidth in Fourier space. Off-resonant components of this frequency band interfere destructively in subsequent oscillations and frequencies close to the resonance ${f}_\mathrm{res}={nc}_{\mathrm{s},\mathit{\operatorname{mod}}}/\left(2{d}_\mathrm{f}\right)\;\left(n\in \mathrm{\mathbb{N}}\right)$ , defined by the modulator’s thickness ${d}_\mathrm{f}$ , are enhanced. This is represented in Figure 2(a) for $t\times {f}_\mathrm{res}\approx 1$ and $n=1$ . With each oscillation of these resonant standing waves within the modulator, a fraction of the initial amplitude is transmitted into the water volume. Figure 2(b) shows the corresponding spectra of the signals. Thus, a pulse train is generated with a carrier frequency at ${f}_\mathrm{res}$ and an envelope function according to the build-up and ring-down defined by the modulators. The entire energy contained in these oscillations is proportional to the spectral amplitude, which is increasing for ${f}_\mathrm{res}$ as the spectrum narrows down. Here, the first-order ${f}_\mathrm{res}={c}_{\mathrm{s},\mathit{\operatorname{mod}}}/\left(2{d}_\mathrm{f}\right)\;\left(n=1\right)$ contains most of the energy with higher orders rapidly decreasing in energy content, that is, spectral amplitude. Therefore, in the following only the first ( $n=1$ ) resonance will be considered.

    (a) Temporal evolution of the initially sharp pressure gradients towards the resonance frequency. (b) Corresponding frequency spectra. The instantaneous pressure (blue, ) shows steep gradients at the modulator foil (shaded region, thickness = ) interfaces corresponding to a broadband frequency spectrum. After the oscillation build-up, all off-resonant frequencies are canceled by destructive interference, and a standing wave (green, ) at resonance frequency, here , emerges. With each cycle a fraction of its amplitude, defined by the acoustic transmittance , is released into the medium as exemplified by the yellow curve (). Thus, the spectrum narrows and the spectral amplitude ( energy content) increases around the resonance frequency. Overall, a pulse train is emitted by the modulator characterized by an envelope (gray dashed) with a build-up function fitted as , which is defined by the modulator’s 3D extent and a ring-down function depending on the material’s acoustic reflectivity, . The characteristic times and specify the signal’s rise and decay time, respectively. The entire modulator signal (red) is thus given by with and a carrier frequency of .

    Figure 2.(a) Temporal evolution of the initially sharp pressure gradients towards the resonance frequency. (b) Corresponding frequency spectra. The instantaneous pressure (blue, ) shows steep gradients at the modulator foil (shaded region, thickness = ) interfaces corresponding to a broadband frequency spectrum. After the oscillation build-up, all off-resonant frequencies are canceled by destructive interference, and a standing wave (green, ) at resonance frequency, here , emerges. With each cycle a fraction of its amplitude, defined by the acoustic transmittance , is released into the medium as exemplified by the yellow curve (). Thus, the spectrum narrows and the spectral amplitude ( energy content) increases around the resonance frequency. Overall, a pulse train is emitted by the modulator characterized by an envelope (gray dashed) with a build-up function fitted as , which is defined by the modulator’s 3D extent and a ring-down function depending on the material’s acoustic reflectivity, . The characteristic times and specify the signal’s rise and decay time, respectively. The entire modulator signal (red) is thus given by with and a carrier frequency of .

    Transmitting through a subsequent modulator foil will only weakly reduce the spectral amplitude of the pulse trains. This is due to the phase difference of the pulse train’s jth wave-cycle reflection ${R}_{j}$ from the back surface relative to the $\left(j+1\right)$ th wave-cycle reflection ${R}_{j+1}$ from the front interface. Due to the phase-shift at the backside reflection, the phase difference is exactly $\pi$ , meaning they interfere destructively. Since the initial amplitude of ${R}_j$ is larger compared to ${R}_{j+1}$ due to the ring-down shape of the pulse trains, their destructive interference is enhanced. Similar to the standing waves shown in Figure 2 (green), each oscillation of the incoming pulse train will excite a new pulse train. Superimposing all of them yields the transmitted pulse, which will be spread temporally compared to the incoming one, that is, its spectrum will be peaked more narrowly around ${f}_\mathrm{res}$ with a higher spectral amplitude. As a result, the transmission of a resonant pulse train through subsequent modulator foils will reduce its energy content by less than 20% in this setting. An ultrasonic piezoelectric transducer (PZT) that relies on the same mechanism is used to measure the signal. The thicknesses ${d}_\mathrm{f}$ of both the Kapton entrance window and the modulator foils were designed such that their fundamental ( $n=1$ ) resonance frequencies ${f}_\mathrm{res}$ coincide with the transducer’s response peak, here equal to 9.8 and 10 MHz, respectively.

    3 Methods

    For all simulations a reference differential TNSA angular and energy proton spectrum with a maximum energy of 60 MeV was assumed[32]. Both energy and angular distributions were included in a FLUKA source file to calculate the energy distribution in the detector[36,37]. The detector was placed 6 cm behind the particle source. Considering the 1.7 cm thickness of the front flange, this defines the source to entrance window distance as 7.7 cm. The entire detector was modeled as shown in Figure 1(a), with an additional 2 cm thick plastic shielding (entrance window spared) and a 15 μm thick aluminum foil in front of the flange, to stop all ions of kinetic energies below approximately 2 MeV and reduce background noise by energy deposited in the detector’s casing.

    Subsequently, the geometry and the deposited energy data were exported to a k-wave code to simulate the resulting pressure evolution within the detector using the deposition data according to Equation (1) as the source[3840]. For pressure measurement, an Olympus Videoscan V311-SU transducer with a resonance frequency of 10 MHz was modeled, while its electrical impulse response function was neglected.

    For the reconstruction of the energy density from a pressure trace, a semi-3D algorithm was specially designed. It requires only the geometry and a measured pressure trace $p(t)$ as input. In the first calculation step, the geometry is reduced to a 1D-array in the direction $x$ normal to the transducer surface, that is, axial to the tank. On this array, for every interface point, all possible propagation paths for a normalized source signal to the transducer are calculated, including reflection and transmission coefficients up to a certain threshold. This is done by multiplying the signal alternating with a propagation matrix and a transducer array, similar to the ABCD-matrices in ray optics. Next, all the detector signals with the same origin are stitched to one array $S(x)$ , which is then scaled accordingly. Scaling happens by the acoustic attenuation $\mathrm{att}(x)$ and the fraction of the signal that actually reaches the transducer $\mathrm{dif}(x)$ when the normalized source signal is diffracted either in two or three dimensions. For the diffraction, the Fresnel-integral is solved. To cover the transverse dimension of the signal shapes, all direct modulator signals $C$ in $p(t)$ are isolated, normalized and convoluted into $S(x)$ to create an array ${S}_\mathrm{c}(x)=S(x)\ast C$ that contains all contributions originating from a single modulator foil. Thus the entire signal at the transducer can be expressed as follows:

    $$\begin{align}p(t)=\sum \limits_{i}{S}_{\mathrm{c},{i}}(x)\times \mathrm{dif}(x)\times \mathrm{att}(x)\times {p}_{0,i}.\end{align}$$  

    Here, $x={c}_\mathrm{s}t$ and ${p}_{0,i}$ is the initial pressure amplitude of the modulator foil $i$ . Minimization of the absolute value of the difference between the envelope of both sides of Equation (2) yields the values for ${p}_{0,i}$ . The absolute energy ${\varepsilon}_{\mathrm{rec},i}$ deposited within a modulator foil $i$ is then calculated by the following:

    $$\begin{align}{\varepsilon}_{\mathrm{rec},i}=\max \left\{\frac{\mathrm{\mathcal{F}}\left[{S}_{\mathrm{c},i}(t)\times {p}_{0,i}\right]}{\Gamma_\mathrm{mod}}\right\}.\end{align}$$  

    For estimating the error of the fit, the pressure-trace $p(t)$ of one example calculation was superimposed with a noise signal. Therefore, a normal-distribution with mean 0 and standard deviation ${\sigma}_\mathrm{n}$ was applied, such that the signal-to-noise ratio (SNR) is then given by $\mathrm{SNR}=E\left[p{(t)}^2\right]/{\sigma}_\mathrm{n}^2$ . The normalized SNR ( $\mathrm{SNR}_{\mathrm{n},i}$ ) was set for each modulator foil individually by scaling $\mathrm{SNR}_{\mathrm{n},i}= \mathrm{SNR}\times E\left[{p}_{i}{(t)}^2\right]/E\left[p{(t)}^2\right]$ , where $E\left[{p}_{i}{(t)}^2\right]$ is the mean square value of the individual modulator signal $i$ . Due to the decrease of energy density with depth, $\mathrm{SNR}_{\mathrm{n},i}$ represents a common metric for all signals independent of their initial pressure amplitude. Further, the performance ratio $q$ of a reconstruction ${\varepsilon}_\mathrm{rec}$ was defined as $q={\varepsilon}_\mathrm{rec}/{\varepsilon}_\mathrm{in}$ , where ${\varepsilon}_\mathrm{in}$ is the reference energy density of the input distribution. All given values for $q$ were averaged over 10 reconstruction runs. As ground truth, an SNR of ${10}^8$ is assumed. Due to the semi-3D approach and the evaluation of only the first-order resonance frequency, the initial reconstruction showed a systematic, geometry dependent off-set of less than 10% in the reference case. This was corrected by multiplying the reconstructed values with a fitted polynomial function. This correction is only depth dependent and remains equal for a fixed detector geometry.

    The average reconstruction time of a depth–dose profile scales linearly with the temporal window that is considered for the isolated signals $C$ . Considering the ring-down function for lead modulator foils, a time frame of 2 μs was found to work best for the 10 modulator foils case. The temporal windows embedded the signals 0.3 μs prior and 1.7 μs post to their arrival timings at the transducer. Here the mean reconstruction time was 0.42 s, which can be considered online given that most state-of-the-art high-power laser systems operate in the Hz repetition rate regime.

    4 Results

    Figure 3(a) presents the pressure trace $p(t)$ that results from the reference source distribution in Figure 1(b) (blue ). Here, 10 modulator lead foils separated by 3 mm were used. The resonance frequencies of the entrance window, modulators and transducer response were tuned to approximately 10 MHz. The last modulator foil with the signal occurring at 46 μs was chosen right behind the Bragg-peak volume of the highest energetic ions ( $\approx$ 60 MeV). For comparison, the pressure signal ${p}_\mathrm{ref}(t)$ for the same ion spectrum without any modulator foils in the water reservoir is shown as well (orange). The Fourier-transformed signals $p(f)=\mathrm{\mathcal{F}}\left[p(t)\right]$ in Figure 3(b) reflect the corresponding spectra. In the modulated case, three features can be distinguished. Firstly, the overall modulation spanning the entire spectrum is produced by the overlap of individual, temporally separated pulse trains and consequently shows a comb with $\Delta f={c}_\mathrm{s}/\left({md}_\mathrm{f}\right)$ , where $m\in \left[1,10\right]$ describes the space numbers in between foils. The second feature is the low frequency peak at $f<$ 2 MHz. This signal is generated by the overall broad deposition region excluding the modulations, that is, a DC background. It contains wavelengths ${\lambda}_\mathrm{DC}$ that are much larger than the thickness of the foils and the transducer’s coating and therefore are not suppressed. Lastly, the actual first- ( $n=1$ ) and second-order modulator ( $n=2$ ) signals are at 9.8 and 19.6 MHz, respectively. The first-order signal contains the majority of the radiated energy and is the basis for the reconstruction.

    Simulated pressure trace of the energy distribution shown in Figure 1(b). In (a) the temporal profile shows the 10 individual modulator pulse trains starting at 46 μs with a spacing of 2 μs (blue). The dashed lines show the onset of the individual foil signals and their corresponding depths with respect to the entrance window. At 67 μs the window signal (EW) is overlapping the pulse of the last modulator. Note that the individual pulses are temporally delayed due to the signals rise times (see Figure 2). For reference, the inset shows the logarithmic signal for a water reservoir without any modulators (orange). (b) The corresponding Fourier-transformed spectra of the pressure traces. In the modulated signal three prominent characteristics can be distinguished. The resonant signals from the entrance window and the modulators manifest in the peaks at 9.8 and 19.6 MHz, that is, the first two resonant modes. A low-frequency (DC) component ( MHz) emitted by the overall spread-out energy deposition region and defined by wavelengths much larger than the foil thickness is also registered as these low frequencies penetrate the modulators unperturbed. The entire signal is superimposed with a frequency modulation defined by the foil spacing. Compared with the unmodulated reference case, the spectral amplitude in the first modulation mode is completely maintained.

    Figure 3.Simulated pressure trace of the energy distribution shown in Figure 1(b). In (a) the temporal profile shows the 10 individual modulator pulse trains starting at 46 μs with a spacing of 2 μs (blue). The dashed lines show the onset of the individual foil signals and their corresponding depths with respect to the entrance window. At 67 μs the window signal (EW) is overlapping the pulse of the last modulator. Note that the individual pulses are temporally delayed due to the signals rise times (see Figure 2). For reference, the inset shows the logarithmic signal for a water reservoir without any modulators (orange). (b) The corresponding Fourier-transformed spectra of the pressure traces. In the modulated signal three prominent characteristics can be distinguished. The resonant signals from the entrance window and the modulators manifest in the peaks at 9.8 and 19.6 MHz, that is, the first two resonant modes. A low-frequency (DC) component ( MHz) emitted by the overall spread-out energy deposition region and defined by wavelengths much larger than the foil thickness is also registered as these low frequencies penetrate the modulators unperturbed. The entire signal is superimposed with a frequency modulation defined by the foil spacing. Compared with the unmodulated reference case, the spectral amplitude in the first modulation mode is completely maintained.

    Comparing both traces in Figure 3, modulated and unmodulated, shows the inherent asset of this detector approach. In the temporal traces it can be seen that the dynamic range in the unmodulated case (orange) is more than ${10}^6$ , that is, it is not possible to reconstruct the signal generated by the initially high energetic ions since the entrance window signal dominates the trace. In contrast, the modulated curve (blue) shows a total dynamic range of ${10}^4$ and for the isolated modulator signals only ${10}^3$ . Thus, common ultrasound transducers can record the entire signal with a high-pressure resolution. Further, from the spectra it becomes clear that the modulation causes a sharp narrowing of the frequency band around the resonance, while the total energy content is slightly increased (spectral amplitude). This may be due to a diffraction effect, as the foils predominantly emit in the axial dimension, whereas the unmodulated instantaneous pressure shows a larger transverse component.

    Figure 4(a) shows the energy density reconstructed from the modulated pressure trace in Figure 3 with an SNR of ${10}^8$ . The agreement between ground truth input and reconstruction is excellent. The ratio of ${\varepsilon}_\mathrm{rec}$ to the input values of ${\varepsilon}_\mathrm{in}$ equals $1\pm 0.003$ for all 11 data points. Figure 4(b) shows this ratio $q={\varepsilon}_\mathrm{rec}/{\varepsilon}_\mathrm{in}$ for each modulator position when artificially reducing the SNR. Because the added noise applies to the complete monotonically decaying curve, the SNR is smaller for a larger depth. Therefore, the SNR was normalized to the signal level at the respective modulator. The reconstruction yields very good results down to a normalized SNR $\gtrsim$ 10. For SNR $<$ 10, the noise amplitude impacts the optimization of ${p}_0$ . As explained above, the signal duration of individual foils increases upon transmission through subsequent foils because their spectrum is narrowed, while their spectral amplitude is reduced only minimally. Regarding the temporal trace this means that the peak-to-mean ratio decreases and hence is lower for modulator signals originating from shallower foils. Whilst in the reconstruction the mean is important, also the peaks contribute notably, whereas the normalized SNR only considers the mean. Therefore, a trend is observable of shallower foils with a worse peak-to-mean ratio starting to increase in the performance ratio at higher SNR values compared to the signals originating from deeper modulators. For noise levels equal to the signals, the optimization predominantly starts to reconstruct the noise instead of the pressure trace. Here $q$ starts to diverge rapidly. For the entrance window this effect sets in at SNR $\approx$ 0.35, whereas the last modulator shows this behavior for SNR $\approx$ 0.08. Hence, the sensitivity of the method to the high-energy part of the spectrum increases by almost an order of magnitude.

    In (a) the energy density reconstruction for an SNR of without filtering is plotted. The relative error to the input is below . (b) The ratio versus the normal SNR for each source foil. For SNR values around 1 the curves start to diverge due to the reconstruction starting to predominantly minimize on the noise signal. A better performance can be observed for temporally more peaked signals originating from deeper modulators. The performance of the reconstruction with Gaussian frequency filtering around with an FWHM of 2 MHz is shown in (c). It is improved by in SNR values as a result of the reduction in noise while simultaneously maintaining the main signal. The performance is better for temporally longer signals, most likely caused by an overestimation of the envelope function used for reconstruction (see Equation (2)) due to resonant noise, yielding a worse result for temporally shorter signals.

    Figure 4.In (a) the energy density reconstruction for an SNR of without filtering is plotted. The relative error to the input is below . (b) The ratio versus the normal SNR for each source foil. For SNR values around 1 the curves start to diverge due to the reconstruction starting to predominantly minimize on the noise signal. A better performance can be observed for temporally more peaked signals originating from deeper modulators. The performance of the reconstruction with Gaussian frequency filtering around with an FWHM of 2 MHz is shown in (c). It is improved by in SNR values as a result of the reduction in noise while simultaneously maintaining the main signal. The performance is better for temporally longer signals, most likely caused by an overestimation of the envelope function used for reconstruction (see Equation (2)) due to resonant noise, yielding a worse result for temporally shorter signals.

    The assignment of a reconstructed energy density to a specific modulator foil limits the spatial resolution to the thickness of this foil, that is, 100 μm, which is similar to what an integrated RCF stack provides. However, the intermediate signal originating from in between foils cannot be reconstructed. Stacking modulators closer and increasing their number will shift the $q$ –SNR curve of shallower sources to higher SNR values (as explained above). Hence, there is a trade-off between the reconstruction of arbitrary distribution sample points and reconstruction performance based on the SNR level. A random noise signal in time as introduced in this study also shows a random noise distribution in Fourier space. This allows for frequency filtering during post-processing to reduce the noise contribution in off-resonant parts of the spectrum. Figure 4(c) exemplifies the result of this method for a Gaussian filter around ${f}_\mathrm{res}$ with a full width at half maximum (FWHM) of $\Delta f=$ 2 MHz. The overall shift to lower SNR values by approximately ${10}^2$ suggests a clear improvement of the reconstruction algorithm as the noise signal is reduced by a fraction of approximately $\Delta f/{f}_{\mathrm{max}}=\Delta f\times \mathrm{d}t/2$ , where $\mathrm{d}t$ is the temporal resolution of the measurement. In addition, the performance ratio $q$ of deeper modulators starts to increase for higher SNR values as compared to signals originating from more shallow foils. It is assumed that this effect and the higher variability are caused by distortions due to the interference between the remaining resonant noise and the actual signal, since the envelope is used for optimization. This overall worsens reconstruction performance for temporally shorter modulator signals or smaller numbers of foils.

    5 Conclusion

    The simulation study suggests that TIMBRE is capable of measuring broadband, laser-accelerated ion bunches. The increased energy density gradient and the enhancement at the resonance frequency due to the modulation of the water reservoir increase the sensitivity by at least $2.5\times {10}^2$ and approximately ${10}^3$ with additional frequency filtering. This suggests that less than ${10}^5$ protons/mm2 even in low-ionizing regions can be detected. An earlier version without modulators has been successfully tested in close vicinity to the laser target and showed little disturbance to EMPs or other noise sources[32].

    In particular, due to its capability of immediate feedback and simplicity, we expect the presented detector approach to become a valuable addition to other diagnostics, if not a primary ion diagnostic for laser–plasma-based ion sources, once tested extensively in experiments.

    References

    [1] R. A. Snavely, M. H. Key, S. P. Hatchettand, T. E. Cowan, M. Roth, T. W. Phillips, M. A. Stoyer, E. A. Henry, T. C. Sangster, M. S. Singh, S. C. Wilks, A. MacKinnon, A. Offenberger, D. M. Pennington, K. Yasuike, A. B. Langdon, B. F. Lasinski, J. Johnson, M. D. Perry, E. M. Campbell. Phys. Rev. Lett., 85, 2945(2000).

    [2] E. L. Clark, K. Krushelnick, J. R. Davies, M. Zepf, M. Tatarakis, F. N. Beg, A. Machacek, P. A. Norreys, M. I. K. Santala, I. Watts, A. E. Dangor. Phys. Rev. Lett., 84, 670(2000).

    [3] A. Maksimchuk, S. Gu, K. Flippo, D. Umstadter, V. Y. Bychenkov. Phys. Rev. Lett., 84, 4108(2000).

    [4] J. Schreiber, P. R. Bolton, K. Parodi. Revi. Sci. Instrum., 87, 071101(2016).

    [5] S. Keppler, N. Elkina, G. A. Becker, J. Hein, M. Hornung, M. Mäusezahl, C. Rödel, I. Tamer, M. Zepf, M. C. Kaluza. Phys. Rev. Res., 4, 013065(2022).

    [6] F. Wagner, O. Deppert, C. Brabetz, P. Fiala, A. Kleinschmidt, P. Poth, V. A. Schanz, A. Tebartz, B. Zielbauer, M. Roth, T. Stöhlker, V. Bagnoud. Phys. Rev. Lett., 116, 205002(2016).

    [7] A. Higginson, R. J. Gray, M. King, R. J. Dance, S. D. R. Williamson, N. M. H. Butler, R. Wilson, R. Capdessus, C. Armstrong, J. S. Green, S. J. Hawkes, P. Martin, W. Q. Wei, S. R. Mirfayzi, X. H. Yuan, S. Kar, M. Borghesi, R. J. Clarke, D. Neely, P. McKenna. Nat. Commun., 9, 724(2018).

    [8] D. Jung, L. Yin, J. Albright, D. C. Gautier, S. Letzring, B. Dromey, M. Yeung, R. Hörlein, R. Shah, S. Palaniyappan. New J. Phys., 15, 023007(2013).

    [9] F. Kroll, F.-E. Brack, C. Bernert, S. Bock, E. Bodenstein, K. Brüchner, T. E. Cowan, L. Gaus, R. Gebhardt, U. Helbig, L. Karsch, T. Kluge, S. Kraft, M. Krause, E. Lessmann, U. Masood, S. Meister, J. Metzkes-Ng, A. Nossula, J. Pawelke, J. Pietzsch, T. Püschel, M. Reimold, M. Rehwald, C. Richter, H.-P. Schlenvoigt, U. Schramm, M. E. P. Umlandt, T. Ziegler, K. Zeil, E. Beyreuther. Nat. Phys., 18, 316(2022).

    [10] B. Dromey, M. Coughlan, L. Senje, M. Taylor, S. Kuschel, B. Villagomez-Bernabe, R. Stefanuik, G. Nersisyan, L. Stella, J. Kohanoff, M. Borghesi, F. Currell, D. Riley, D. Jung, C.-G. Wahlström, C. L. S. Lewis, M. Zepf. Nat. Commun., 7, 10642(2016).

    [11] M. Taylor, M. Coughlan, G. Nersisyan, L. Senje, D. Jung, F. Currell, D. Riley, C. L. S. Lewis, M. Zepf, B. Dromey. Plasma Phys. Control. Fusion, 60, 054004(2018).

    [12] A. Prasselsperger, M. Coughlan, N. Breslin, M. Yeung, C. Arthur, H. Donnelly, S. White, M. Afshari, M. Speicher, R. Yang, B. Villagomez-Bernabe, F. J. Currell, J. Schreiber, B. Dromey. Phys. Rev. Lett., 127, 186001(2021).

    [13] M. Roth, T. E. Cowan, M. H. Key, S. P. Hatchett, C. Brown, W. Fountain, J. Johnson, D. M. Pennington, R. A. Snavely, S. C. Wilks, K. Yasuike, H. Ruhl, F. Pegoraro, S. V. Bulanov, E. M. Campbell, M. D. Perry, H. Powell. Phys. Rev. Lett., 86, 436(2001).

    [14] J. Badziak, J. Domanski. Nucl. Fusion, 61, 046011(2021).

    [15] J. Badziak, J. Domanski. Nucl. Fusion, 62, 086040(2022).

    [16] M. Borghesi. Nucl. Instrum. Methods Phys. Res. A, 740, 6(2014).

    [17] F. H. Lindner, J. H. Bin, F. Englbrecht, D. Haffa, P. R. Bolton, Y. Gao, J. Hartmann, P. Hilz, C. Kreuzer, T. M. Ostermayr, T. F. Rösch, M. Speicher, K. Parodi, P. G. Thirolf, J. Schreiber. Rev. Sci. Instrum., 89, 013301(2018).

    [18] S. Reinhardt, C. Granja, F. Krejci, W. Assmann. J. Instrum., 6, C12030(2011).

    [19] K. Harres, M. Schollmeier, E. Brambrink, P. Audebert, A. Blazevic, K. Flippo, D. C. Gautier, M. Geißel, B. M. Hegelich, F. Nürnberg, J. Schreiber, H. Wahl, M. Roth. Rev. Sci. Instrum., 79, 093306(2008).

    [20] D. C. Carroll, P. Brummitt, D. Neely, F. Lindau, O. Lundh, C.-G. Wahlström, P. McKenna. Nucl. Instrum. Methods Phys. Res. Sect. A, 620, 23(2010).

    [21] L. D. Geulig, L. Obst-Huebl, K. Nakamura, J. Bin, Q. Ji, S. Steinke, A. M. Snijders, J.-H. Mao, E. A. Blakely, A. J. Gonsalves, S. Bulanov, J. van Tilborg, C. B. Schroeder, C. G. R. Geddes, E. Esarey, M. Roth, T. Schenkel. Rev. Sci. Instrum., 93, 103301(2022).

    [22] W. L. McLaughlin, Y.-D. Chen, C. G. Soares, A. Miller, G. Van Dyk, D. F. Lewis. Nucl. Instrum. Methods Phys. Res. Sect. A, 1, 165(1991).

    [23] R. M. Cassou, E. V. Benton. Nucl. Track Detection, 2, 173(1978).

    [24] K. Parodi, W. Assmann. Mod. Phys. Lett. A, 30, 1540025(2015).

    [25] L. Sulak, T. Armstrong, H. Baranger, M. Bregman, M. Levi, D. Mael, J. Strait, T. Bowen, A. E. Pifer, P. A. Polakos, H. Bradner, A. Parvulescu, W. V. Jones, J. Learned. Nucl. Instrum. Methods, 161, 203(1979).

    [26] G. A. Askariyan, B. A. Dolgoshein, A. N. Kalinovsky, N. V. Mokhov. Nucl. Instrum. Methods, 164, 267(1979).

    [27] D. Haffa, R. Yang, J. Bin, S. Lehrack, F. Brack, H. Ding, F. S. Englbrecht, Y. Gao, J. Gebhard, M. Gilljohann, J. Götzfried, J. Hartmann, S. Herr, P. Hilz, S. D. Kraft, C. Kreuzer, F. Kroll, F. H. Lindner, J. Metzkes-Ng, T. M. Ostermayr, E. Ridente, T. F. Rösch, G. Schilling, H.-P. Schlenvoigt, M. Speicher, D. Tarayand, M. Würl, K. Zeil, U. Schramm, S. Karsch, K. Parodi, P. R. Bolton, W. Assmann, J. Schreiber. Sci. Rep., 9, 6714(2019).

    [28] W. Assmann, S. Kellnberger, S. Reinhardt, S. Lehrack, A. Edlich, P. G. Thirolf, M. Moser, G. Dollinger, M. Omar, V. Ntziachristos, K. Parodi. J. Med. Phys., 42, 567(2015).

    [29] S. Lehrack, W. Assmann, M. Bender, D. Severin, C. Trautmann, J. Schreiber, K. Parodi. Nucl. Instrum. Methods Phys. Res. A, 950, 162935(2020).

    [30] S. Lehrack, W. Assmann, D. Bertrand, S. Henrotin, J. Herault, V. Heymans, F. Vander Stappen, P. G Thirolf, M. Vidal, J. Van de Walle, K. Parod. Phys. Med. Biol., 62, L20(2017).

    [31] S. Kellnberger, W. Assmann, S. Lehrack, S. Reinhardt, P. G. Thirolf, D. Queiros, G. Sergiadis, G. Dollinger, K. Parodi, V. Ntziachristos. Sci. Rep., 6, 29305(2016).

    [32] F. Balling, S. Gerlach, A.-K. Schmidt, V. Bagnoud, J. Hornung, B. Zielbauer, K. Parodi, J. Schreiber, 11779, 117790T(2021).

    [33] T. Takayanagi, T. Uesaka, M. Kitaoka, M. B. Unlu, K. Umegaki, H. Shirato, L. Xing, T. Matsuura. Sci. Rep., 9, 4011(2019).

    [34] T. Takayanagi, T. Uesaka, Y. Nakamura, M. B. Unlu, Y. Kuriyama, T. Uesugi, Y. Ishi, N. Kudo, M. Kobayashi, K. Umegaki, S. Tomioka, T. Matsuura. Sci. Rep., 10, 20385(2020).

    [35] M. Ahmad, L. Xiang, S. Yousefi, L. Xing. Med. Phys., 42, 5735(2015).

    [36] A. Ferrari, J. Ranft, P. R. Sala, A. Fasso. Fluka: A Multiparticle Transport Code(2005).

    [37] T. T. Böhlen, F. Cerutti, M. P. W. Chin, A. Fasso, A. Ferrari, P. G. Ortega, A. Mairani, P. R. Sala, G. Smirnov, V. Vlachoudis. Nucl. Data Sheets, 120, 211(2014).

    [38] B. E. Treeby, B. T. Cox. J. Biomed. Opt., 15, 021314(2010).

    [39] B. E. Treeby, B. T. Cox. J. Acoust. Soc. Am., 127, 2741(2010).

    [40] B. E. Treeby, J. Jaros, A. P. Rendell, B. T. Cox. J. Acoust. Soc. Am., 131, 4324(2012).

    A. Praßelsperger, F. Balling, H.-P. Wieser, K. Parodi, J. Schreiber. Ion-bunch energy acoustic tracing by modulation of the depth-dose curve[J]. High Power Laser Science and Engineering, 2023, 11(3): 03000e42
    Download Citation