
Miao Li, Tong Yao, Zuhua Yang, Jun Shi, Feng Wang, Guohong Yang, Minxi Wei, Ao Sun, Yang Li. Designing a toroidal crystal for monochromatic X-ray imaging of a laser-produced He-like plasma[J]. High Power Laser Science and Engineering, 2022, 10(6): 06000e37
- High Power Laser Science and Engineering
- Vol. 10, Issue 6, 06000e37 (2022)
Abstract
1 Introduction
Inertial confinement fusion (ICF)[1,2] technology relies on high-power lasers to achieve controlled nuclear fusion via the inertial confinement route. On 8 August 2021, an experiment conducted at the Lawrence Livermore National Laboratory’s National Ignition Facility (NIF) made a significant breakthrough in nuclear fusion ignition, achieving a yield of more than 1.3 MJ[3]. This advancement puts researchers at the threshold of nuclear fusion ignition, which is an important goal of the NIF, and paves the way to a new experimental regime. The energy conversion process in ICF has garnered considerable interest among researchers worldwide, and extensive investigations have been conducted to evaluate this energy conversion process. However, for an effective implementation of the ICF process[4,5], it is necessary to analyze the X-rays emitted in the confined plasma using focus imaging. A spectrometer with a customized crystal as the spectroscopic element can be used to detect and image the X-rays emitted in a confined plasma[6,7]. Correspondingly, a crystal spectrometer is a powerful tool for analyzing ICF plasma X-rays[8–11].
Currently, various experimental devices are being upgraded as well as developed to promote and advance the experimental research on ICF. A flat crystal spectrometer is a simple instrument for detecting X-rays[12]. Moreover, perfectly flat crystals are now widely available and are relatively cheap, whereas thin and bendable crystals that can be designed into desirable shapes require additional preparation and are therefore more expensive. However, the experimental X-ray collection efficiency of a flat crystal is low, and the spectral resolution is largely affected by the source size; therefore, high-resolution detection cannot be performed using a flat crystal spectrometer[13]. To overcome the shortcomings of flat crystal spectrometers, bent crystal spectrometers were developed and extensively investigated[14–16]. The presently used bent crystal spectrometers contain spectroscopic crystals with different structures, such as cylindrical[17], spherical[18], conical[19,20] and elliptical[21]. These bent crystals can enhance the focusing characteristics and spectral resolution of the spectrometers. The cylindrical crystal is the critical component of the basic von Hamos spectrometer. A partial problem of a cylindrical crystal scheme is the shallow incidence angle on the detector plane, which is parallel to and intersecting with the cylinder axis. Therefore, the placement of the X-ray detectors is made difficult, as they are usually preferred to be quasi-perpendicular to the incidence of the X-ray[22]. The conical crystal was designed to overcome this defect by bending the crystal over the surface of a cone instead of a cylinder. However, the spatial resolution along the focusing direction is limited by the spherical aberrations, because the X-ray source does not locate on the cone axis[23]. These 1D bent or 2D bent crystals may have high luminosity and high spectral resolution, but the physical constraints of the laser facility, such as the diagnostic space envelope on the laser target chamber or the minimum radius of curvature to which the crystals can be bent, must be considered in the experimental designs. Among 2D bent crystals, the spherically curved crystal is still one of the most widely used crystals since it can offer outstanding combinational performance, such as high spectral and relatively large spectral interval coverage. Although the spherical spectrometer can provide simultaneously spectral and 2D spatial resolution by positioning the source and detector properly, the incidence Bragg angle is required to be close to 90° to avoid aberration.
These drawbacks of spectrometers equipped with crystals of different structures indicate that a crystal spectrometer with strong focusing and high-resolution characteristics needs to be urgently developed for detecting the plasma X-rays emitted in the current ICF devices. In this paper, a toroidal quartz crystal-based imaging system for the focus imaging of He-like Ti X-rays emitted at 4.75 keV was proposed. The simulation and experimental results show that the designed toroidal quartz crystal can achieve the same magnification ratio in the sagittal and meridional planes. A spatial resolution of approximately 5 μm is obtained for the simulated image.
Sign up for High Power Laser Science and Engineering TOC. Get the latest issue of High Power Laser Science and Engineering delivered right to you!Sign up now
2 Toroidal crystal design for monochromatic X-ray imaging
For using crystals in backlight imaging experiments, the crystal material and energy of the X-rays must satisfy the Bragg condition[24]:
At present, the spherical crystal[25] is widely used in imaging systems based on X-ray diffraction. The imaging principle of such systems can be illustrated using the ‘Rowland circle’, as shown in Figure 1. Here, qm and qs represent the imaging distance (from the crystal center to the imaging point) in the meridional and sagittal planes, respectively, and can be defined as qm = Rsinθ/2 and qs = R/2sinθ, and p is the distance from the object to the center of the crystal. Notably, Im is the best position for spectral detection. The diameter of the Rowland circle is equal to the radius (R) of the spherical crystal. The X-rays emitted by the source, satisfying the Bragg condition given by Equation (1), at a point on the Rowland circle are focused at another point (Im) on the Rowland circle after being diffracted by the spherical crystal. The Rowland circle lies in the meridional plane. However, in the sagittal plane, which is perpendicular to the plane of the Rowland circle, the effect of the spherical crystal on the X-rays is equivalent to that of a concave mirror. Thus, the crystal can focus the X-rays at the focal point (Is) of the plane. According to the lens formula and the aforementioned definitions of qm and qs, the following equations can be obtained:
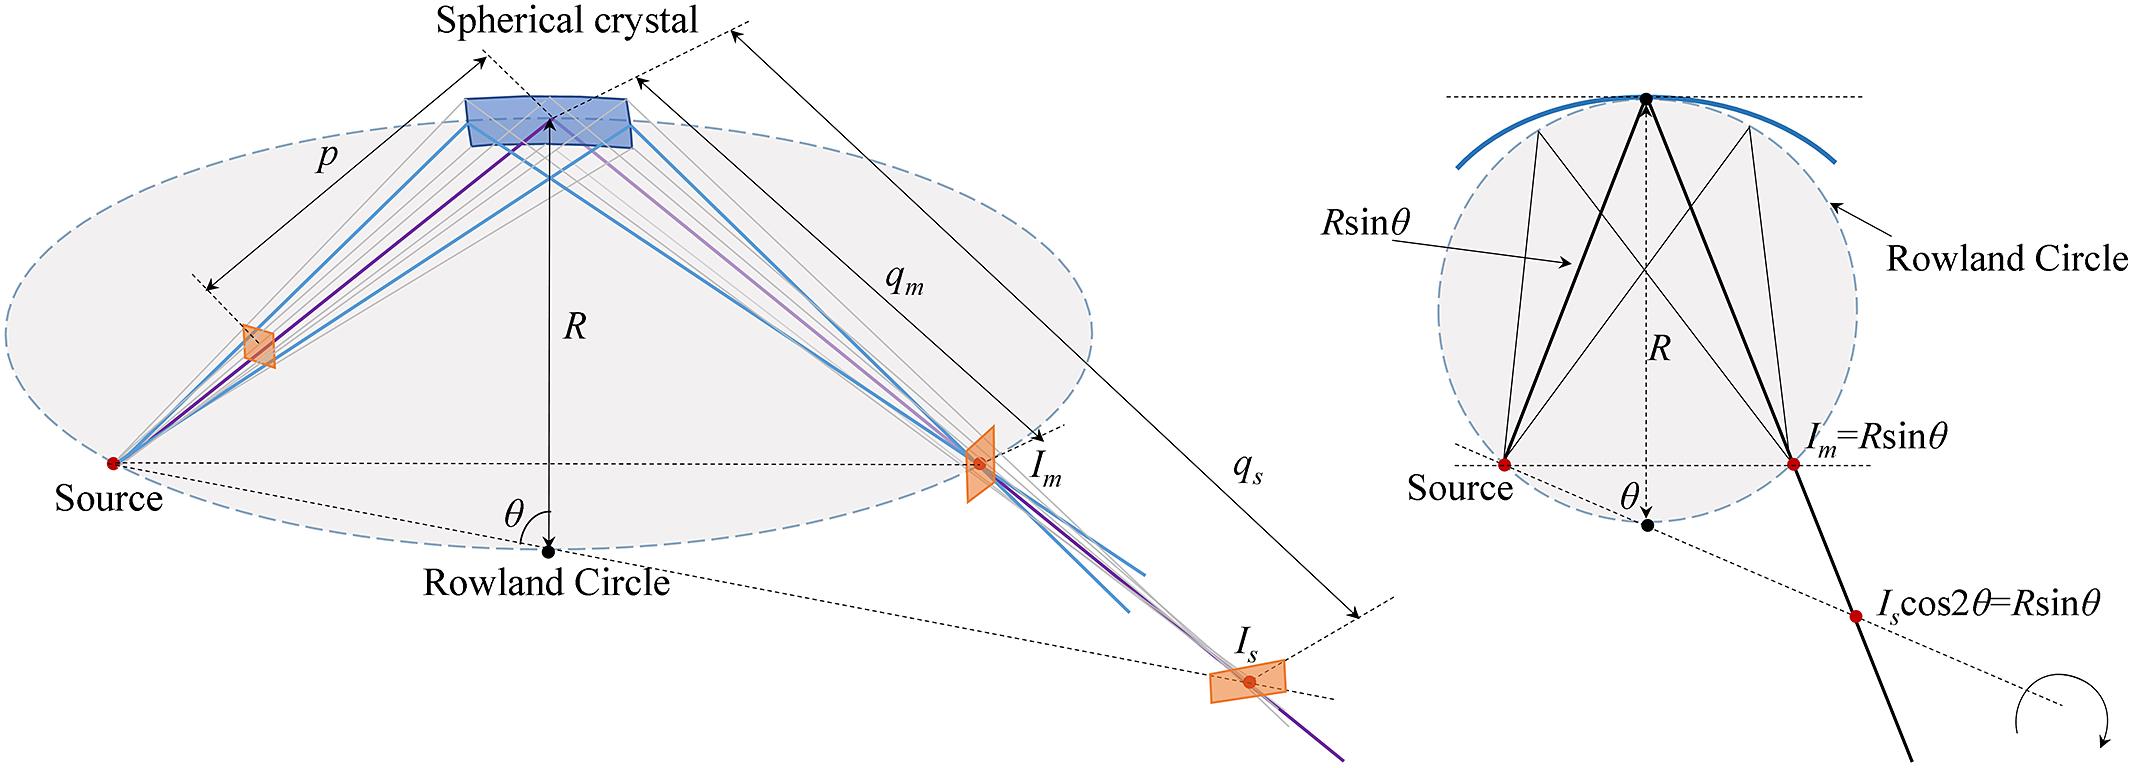
Figure 1.Working principle of a spherical crystal-based imaging system. The X-rays emitted by the source are focused at point (
When a spherical crystal is used for backlight imaging, the final image contains large aberrations[26]. To reduce the image aberrations as much as possible, the values of qm and qs in Equations (2) and (3) must be approximately equal, so as to guarantee the same magnification ratio at the imaging point in the sagittal and meridional planes, respectively. To satisfy this condition and obtain a high-quality backlight image using a spherical crystal, the crystal’s Bragg angle should be nearly equal to 90°, although this requirement limits the range of X-ray energies that can be selected by the crystal.
This limitation of spherical crystals can be mitigated by using a toroidal crystal structure. An imaging system based on a toroidal crystal is shown in Figure 2. Unlike the spherical crystal, the toroidal crystal has different radii in the meridional and sagittal planes, represented by Rm and Rs, respectively.
![]()
Figure 2.Working principle of a toroidal crystal-based imaging system. In the case of a toroidal crystal, the rays from the sagittal and meridional planes are focused at the same focal point. The toroidal crystal can be used for imaging self-luminous objects without requiring a Bragg angle close to 90°.
Therefore, applying the lens formula in this case, one obtains the following:
In the case of a toroidal crystal, the rays from the sagittal and meridional planes should be focused at the same focal point. Therefore, the radii of the crystal in the sagittal and meridional planes must satisfy the following relationship:
For toroidal crystals, the same image magnification is obtained in both the sagittal and meridional planes. Thus, a toroidal crystal, obtained by changing the radius of curvature of a spherical crystal on the sagittal plane, can be used to produce focused images with reduced astigmatism by optimizing the radius of the crystal according to the energy of the X-rays to be imaged. It should be noted that the object image should not be usually designed on the Rowland circle in order to separate the possibility of distinguishing between the source radiation and the self-emission of the object. The toroidal crystal allows for a smaller Bragg angle, which can facilitate the integration of multiple channels, and the astigmatism is eliminated and the resolution is significantly improved when the radii of the crystal in the sagittal and meridional planes satisfy Equation (6). This advantage of the toroidal crystal over a spherical crystal is particularly beneficial for performing high-resolution imaging analysis of implosion plasma under different X-ray energies.
3 Dynamic X-ray diffraction simulation
To date, different methods have been reported to simulate X-ray diffraction[27] for different detection requirements. In this study, a self-developed simulation program[28] was used for analyzing the focus-imaging performance of the proposed toroidal crystal-based imaging system. Firstly, the Monte Carlo method was used to develop a specific X-ray source with various parameters, including shape, angle, energy distribution and other related parameters of the X-rays of the required/given energy range. Next, the dynamic diffraction equation, based on the multi-lamellar approach[27], was used to calculate the X-ray diffraction rates in the toroidal crystal. Finally, the propagation trajectory and spatial and intensity distributions of the diffracted X-rays were obtained on the image plane. Based on the calculated spatial and intensity distributions of the X-rays at different positions, a 3D spatial model was established as shown in Figure 3, which also illustrates the ray propagation trajectory. In the 3D simulation results shown in Figure 3, the color of the ray represents different energies, and the brightness represents intensity. However, the simulated trajectory shown in Figure 3 was obtained for 4.75 keV monochromatic rays to verify the grid imaging distribution and, therefore, the corresponding energy and intensity changes are not obvious in this case. To ensure that the ideal image satisfies Equations (4) and (5), the distance from the source to the crystal center was set to 281.6 mm, and a 3×3 metal grid, with the individual grid size of 100 μm × 100 μm (gap of 50 μm), was used as the imaging object. The distance from the metal grid to the crystal center was 170 mm, and the imaging distance (from the imaging plate to the crystal center) was 850 mm.
![]()
Figure 3.Simulated 3D diffracted beam trajectory of the designed toroidal crystal spectrometer.
The wavelength of the He-like Ti X-rays is 0.262 nm. Thus, a quartz (
![]()
Figure 4.Calculated Darwin reflectivity curves based on the multi-lamellar method: (a) p-polarized X-rays; (b) s-polarized X-rays.
In this study, the X-ray diffraction by a spherical crystal (with a radius of 295.6 mm) and a toroidal crystal of the same material was simulated, and the corresponding imaging results were compared, as shown in Figure 5. A highly resolved image of the X-rays diffracted by the spherical crystal (Figure 5(a)) was obtained, which showed obvious dividing lines in-between the grids in the meridional direction (z-axis). The length of the imaging grid in the meridional direction was found to be approximately 500 μm, which was four times longer than that of the metal grid and satisfied Equation (7). Conversely, the length of the imaging grid in the sagittal plane (x-axis) was found to be approximately 1000 μm, which did not satisfy Equation (7). Moreover, the aspect ratio of the grid image was approximately 2.
![]()
Figure 5.Comparison of the simulation imaging results: (a) image produced by a spherical crystal; (b) image produced by a toroidal crystal.
The simulation results of the imaging performance of the spherical crystal and toroidal crystal indicate that the grid image was severely deformed. It is observed that the grid image in the sagittal plane was severely widened, resulting in almost no grid image formation in the sagittal plane; only one column of the 3×3 array grid was observed on the image plane. This implies that a spherical crystal shows poor focusing performance with an obvious aberration in the sagittal plane. This aberration affects the spatial resolution of the final image. Figure 5(b) shows the X-rays diffracted by the toroidal crystal. Evidently, in this case, the diffracted X-rays have high resolution in the meridional and sagittal planes. The grid images in both directions could be easily distinguished, and the length of the imaging grid was found to be equal to 500 μm in both directions. This satisfies Equation (7); in addition, the aspect ratio of the grid image was approximately 1; thus, the grid image did not show any deformation. Thus, a toroidal crystal is an ideal X-ray diffraction-based spectroscopic element. Neglecting manufacturing imperfections such as local variations of the crystal surface or the bending radius, the spatial resolution σ of an imaging system with a crystal aperture is defined by astigmatism. The spatial resolution of the image (σ) can be calculated using the following equations[28,29]:
![]()
Figure 6.Comparison of simulation spectral imaging results: (a) image spectrum of the spherical crystal in the sagittal plane; (b) image spectrum of the toroidal crystal in the sagittal plane; (c) image spectrum of the spherical crystal in the meridional plane; (d) imaging spectrum of the toroidal crystal in the meridional plane.
The spatial resolution of the images formed by the spherical and toroidal crystals in the sagittal and meridional planes can be calculated using Equation (8). Accordingly, the spatial resolutions of the images formed by the spherical crystal in the meridional and sagittal planes were found to be approximately 5 and 15 μm, respectively, and those of the images formed by the toroidal crystal in the meridional and sagittal planes were both approximately 5 μm. The calculated results indicated that a toroidal crystal can produce high-resolution images in both the meridional and sagittal planes, and the spatial resolutions of the crystals in these two planes are approximately equal. In contrast, a spherical crystal can produce a high-resolution image only in the meridional plane; in the sagittal plane, a highly diverged and poorly resolved image is obtained. Comparing and analyzing the spatial resolutions of the spherical and toroidal crystal-produced images showed that the spatial resolution of the image formed by the spherical crystal in the meridional plane was approximately equal to that of the image formed by the toroidal crystal. However, the image produced by the spherical crystal in the sagittal plane showed a relatively lower resolution than that produced by the toroidal crystal.
To further prove the strong focusing characteristics of the toroidal crystal, a simulation of the focused image produced by both the spherical and toroidal crystals was performed. In the simulation, it established a source of a definite size (a circular spot with a radius of 50 μm), and obtained the focused image of the X-rays emitted by the source and diffracted by the spherical and toroidal crystals. The parameters of the diffractive crystals, used in this simulation, were the same as those used in the previous spatial resolution simulation. The final results are shown in Figure 7. As can be seen from Figure 7(a), the size of the circular spot diffracted by the spherical crystal was different in the meridional and sagittal planes. Evidently, the image in the meridional plane was better focused, and the initial size of the source could be estimated from this image. However, the X-ray beam size in the focused area on the meridional plane was approximately 50 μm, whereas that in the sagittal plane was severely defocused with a size of approximately 400 μm.
![]()
Figure 7.Focused image of the source: (a) focused image of the source produced by the spherical crystal; (b) focused image of the source produced by the toroidal crystal.
This difference between the focus in the meridional plane and that in the sagittal plane caused deformation in the final image of the source. The image of the source expanded in the sagittal plane, and the shape of the source appeared to be approximately elliptical. Figure 7(b), on the other hand, shows that the toroidal crystal produced a highly focused circular spot, and the size of the imaged spot was approximately equal to that of the original source. In addition, the sizes of the imaged spot in the meridional and sagittal planes were almost equal. Moreover, the normalized maximum intensity of the focused beam produced by the spherical crystal was approximately 0.16, whereas that of the focused beam produced by the toroidal crystal was approximately 1. Thus, the intensity of the X-rays diffracted by the toroidal crystal was 6.25 times that of the X-rays diffracted by the spherical crystal, indicating that the focusing characteristics of the toroidal crystal were significantly better than those of the spherical crystal. The overall simulation results showed that a toroidal crystal possesses strong focusing characteristics and can effectively focus the X-rays emitted by a source, thereby improving the intensity of the emitted X-rays. This is convenient for subsequent data processing and analysis and indicates that a toroidal crystal-based imaging system can perform efficient detection of plasma X-rays.
4 Slope error analysis using the power spectral density function
Most of the 2D bent crystals could be fabricated by the classical method of pre-polishing and hot plastic deformation[31]. A discussion of the manufacturing process that deforms perfect crystals without deteriorating their crystal quality and deforming crystals into an arbitrary shape for compact optics is beyond the scope of this paper and has been well discussed elsewhere[32,33]. However, due to the manufacturing limitation, the precision of the processing device, the properties of the crystal material and other factors, there exists a slope error on the fabricated crystal surface. To explain the discrepancy of focusing performance between the fabricated crystal and the theoretically designed crystal, diffraction simulations with different surface errors were carried out. Although the parameter values are the same as that of the previous simulation, the slope error is considered as well. This paper mainly conducts simulations for the value of slope error in the range of 0–15 μm (see Figure 8).
![]()
Figure 8.Surface roughness distribution used in the simulation. The surface data can be combined with the designed crystal surface data. The roughness distribution has more serious variance in the
In addition to the above-mentioned focusing performance analyses, bent crystals can be analyzed by using methods of fractal geometry, such as power spectral density (PSD) functions, to provide topographical parameters (equivalent roughness, fractal dimension). The algorithm of the PSD function, in contrast to conventional statistical analysis, has proven successes in the description of various complex surface geometries as well as in understanding the effects of surface morphology on the properties of material systems[34]. By applying PSD functions, the assumed surface roughness can be represented by spectral strength densities over a wide range of different spatial frequencies; therefore, roughness data acquired from different spatial frequency regions can be directly compared[35].
The surface slope error is often represented by simple statistical parameters, such as root-mean-square (RMS) roughness, which is defined as the RMS average of height deviations from the mean elevation plane, calculated from the relative height of each pixel in the image:
Figure 9 shows the imaging results under different slope error conditions. As can be seen from the figure, with increasing slope error RMS, the grid starts to shift to the left in the x-axis direction; in other words, the accuracy of the focusing performance gradually decreases. When the value exceeds 3 μm, the deformation of the imaging grid is obvious, and the imaging grid is compressed in the z-axis direction. In addition, as the value of slope error continues to increase, the imaging grid begins to deform. When the value reaches 15 μm, the 3×3 array grid can hardly be distinguished. The maximum offset of the imaging grid is 2 mm from the center in the x-direction and the deformation of the imaging grid is mainly concentrated in the z-axis direction. The imaging grid in row 2 overlaps the imaging grid in row 3, and the imaging grid array is compressed to 400 μm in the z-axis. The array of the original imaging grids has a length of 2000 μm in the z-axis direction.
![]()
Figure 9.Imaging under different conditions of slope error RMS values: (a) imaging when the surface error RMS is 0 μm; (b) imaging when the surface error RMS is 1 μm; (c) imaging when the surface error RMS is 3 μm; (d) imaging when the surface error RMS is 5 μm; (e) imaging when the surface error RMS is 10 μm; (f) imaging when the surface error RMS is 15 μm.
In our simulation, the slope error was randomly generated. Although the imaging offsets caused by the surface deformation were stochastic, the scale of the distortion and the corresponding critical RMS value were almost the same. Hence, the value of the slope error needs to be controlled to approximately 15 μm in the actual fabrication process of the crystal.
5 Experimental X-ray imaging using a toroidal crystal
Considering the current manufacturing capability, the quartz crystal, compared with Si, is more flexible to deform into different shapes with a specific curvature. However, the diffraction efficiency of a quartz crystal is much weaker than that of Si, which means it is difficult to verify the experimental performance by using a laboratory X-ray source. Thus, to ascertain the imaging performance of a toroidal crystal spectrometer, an actual experiment of diffraction-focus imaging of He-like Ti X-rays was conducted using a laser beam with a pulse width of 920 ps and energy of 1137.34 J. As mentioned before, the central wavelength of the He-like Ti X-rays is 0.262 nm. A toroidal quartz crystal (2d = 0.2749 nm) was employed as the core element of the imaging system, with meridional and sagittal radii of 295.6 and 268.5 mm, respectively, and a Bragg angle of 72.3°. The toroidal quartz crystal used in this experiment is shown in Figure 10. The imaging object was a 3×3 metal grid, in which each grid was 100 μm × 100 μm (gap of 50 μm) in size, and an X-ray imaging plate was used as the image plane. Based on the calibration requirements of the image optical path, the source, the center of the toroidal crystal and the center of the imaging plate were all oriented in the same plane.
![]()
Figure 10.Image of the toroidal crystal used in the experiment (crystal size: 45 mm × 20 mm, supported on a BK7 glass).
The other experimental parameters were exposure time of 300 s, distance from the source to the crystal center of 281.6 mm, distance from the metal grid to the crystal center of p = 170 mm, distance from the imaging plate to the crystal center of q = 850 mm and pixel size of the imaging plate of 25 μm. To reduce the influence of stray light on the imaging results, a 10 μm Al filter was placed in front of the imaging plate. According to Equation (7), an image magnification of 5 was expected in the experimental results.
The experimental imaging result of the laser spot is shown in Figure 11. Evidently, the intensities of the X-rays emitted by the source were not uniform, and the image of the overall grid was also not deformed. In addition, the image magnifications in the meridional and sagittal planes were approximately equal to 5 (the magnifications of the meridional and sagittal planes are 5.03 and 5.1, respectively), which was close to the expected value. A highly resolved grid pattern was obtained in the actual experiment. Using Equation (8), the spatial resolution was found to be equal to approximately 10 μm, which was slightly different from that obtained in the simulation because of the following possible reasons. (1) An ideal toroidal crystal was considered in the simulated imaging system; in this case, the diffraction of a specific X-ray wavelength by the crystal can be considered as a mirror reflection and, hence, geometric aberrations due to the penetrating power of X-rays are nullified. (2) An ideal source was considered in the simulated system and, consequently, the influence of the source size on the resolution was not included in the simulations. (3) The inherent defects and surface deformations in the crystal cause the propagation path of the rays to deviate, leading to defocusing of the diffracted X-rays.
![]()
Figure 11.Backlight imaging results of the quartz toroidal crystal, raw image (zoom in) and intensity map.
In addition, the resulting backlight image produced by the toroidal quartz crystal was processed using relevant software to extract the relationship between the relative intensity of the X-rays in the sagittal plane and the grid position. The corresponding results are shown in Figure 12. The relevant imaging parameters of the backlight imaging system are listed in Table 1. The crystal spectrometer using the fabricated toroidal crystal allows for a smaller Bragg angle and achieves improved resolution, while the astigmatism is eliminated. The improvement of the manufacturing process, which can guarantee the designed crystal deformation and the smaller source size, could facilitate better resolution performance in future experiments.
![]()
Figure 12.Spatial intensity distribution of the imaging grid.
| Imaging parameters | Backlight imaging system |
|---|---|
| System magnification | M = 5 |
| Field of view/mm2 | VFOVmeridional = 31.12; VFOVsagittal = 28.26 |
| Spatial resolution/μm | 10 |
| Collection solid angle/sr | 0.0079 |
Table 1. Imaging parameters of a backlight imaging system.
6 Conclusion
Herein, a toroidal quartz crystal-based imaging system is proposed and the imaging performance of the crystal with a Ti target laser source is discussed. The simulation and experimental results show that the designed toroidal quartz crystal can achieve the same magnification ratio in the sagittal and meridional planes. The grid image in both the planes is clearly distinguishable, and almost no deformation is observed in the image. A spatial resolution of approximately 5 μm is obtained for the simulated image. In the experiment, a laser source with a Ti target was used to analyze the monochromatic X-ray imaging performance of the toroidal quartz crystal. Through the backlight imaging experiment, a focused image with a magnification of 5 in the meridional and sagittal planes is obtained. The spatial resolution of the diffraction image produced by the toroidal quartz crystal is 10 μm. A slight difference between the simulated and experimental resolutions, depending on the size of the actual source, geometric aberrations and crystal defects, is observed. The effect of these factors on the final resolution of the image will be evaluated in a future study.
In summary, a toroidal quartz crystal-based imaging system can be used to produce strongly focused and highly resolved X-ray diffraction images. Such advanced systems will pave the way for efficient spectral detection of high-energy-density plasmas.
References
[1] S. Pfalzner. An Introduction to Inertial Confinement Fusion(2006).
[2] J. D. Lindl. Inertial Confinement Fusion: The Quest for Ignition and Energy Gain Using Indirect Drive(1998).
[3] . Nat. Photon., 15, 713(2021).
[4] S. M. FinneganReference Module in Earth Systems and Environmental Sciences. , (Elsevier, ).(2021).
[5] J. D. Sadler, H. Li, B. M. Haines. Phys. Plasmas, 27, 072707(2020).
[6] J. Lind, F. Fetzer, S. D. Blazquez, J. Weidensdrfer, T. Graf. Proceedings of the ICALEO, 7(2019).
[7] M. Bitter, N. Pablant, K. W. Hill, L. Gao, D. Thorn. Rev. Sci. Instrum., 92, 043531(2021).
[8] O. Renner, F. B. Rosmej. Matter Radiat. Extremes, 4, 024201(2019).
[9] M. J. Haugh, M. Wu, K. D. Jacoby, G. P. Loisel. Rev. Sci. Instrum., 85, 11D619(2014).
[10] J. F. Seely, J. L. Glover, L. T. Hudson, Y. Ralchenko, A. Henins, N. Pereira, U. Feldman, C. A. DiStefano, C. C. Kuranz, R. P. Drake, H. Chen, G. J. Williams, J. Park. Rev. Sci. Instrum., 85, 11D618(2014).
[11] S. Yi, F. Zhang, Q. Huang, L. Wei, Y. Gu, Z. Wang. High Power Laser Sci. Eng., 9, e42(2021).
[12] G. Hölzer, O. Wehrhan, E. Förster. Cryst. Res. Technol., 33, 555(1998).
[13] R. R. Wang, G. Jia, H. H. An, Z. Y. Xie, W. Wang. X-Ray Spectrom., 51, 136(2022).
[14] J. Shi, T. Yao, M. Li, G. Yang, M. Wei, W. Shang, F. Wang. Chin. Opt. Lett., 18, 113401(2020).
[15] A. A. Petrunin, A. E. Sovestnov, A. V. Tyunis, V. Fomin. Tech. Phys. Lett., 35, 73(2009).
[16] A. P. Shevelko, Y. S. Kasyanov, O. F. Yakushev, L. V. Knight. Rev. Sci. Instrum., 73, 3458(2002).
[17] K. Shah, M. B. Chowdhuri, G. Shukla, R. Manchanda, K. B. K. Mayya, K. A. Jadeja, N. A. Pablant, J. Ghosh. Rev. Sci. Instrum., 89, 10F115(2018).
[18] E. P. Jahrman, W. M. Holden, A. S. Ditter, A. A. Kozimor, G. T. Seidler. Rev. Sci. Instrum., 90, 013106(2019).
[19] J. I. Robledo, C. A. Pérez, H. J. Sánchez. Rev. Sci. Instrum., 91, 043105(2020).
[20] M. Bitter, K. W. Hill, L. Gao, P. C. Efthimion, L. Delgado-Aparicio, S. Lazerson, N. Pablant. Rev. Sci. Instru., 87, 11E333(2016).
[21] R. W. Rong, H. H. An, E. F. Guo, W. Wang. Rev. Sci. Instrum., 89, 093109(2018).
[22] L. Anklamm, C. Schlesiger, W. Malzer, D. Grötzsch, M. Neitzel, B. Kanngießer. Rev. Sci. Instrum., 85, 053110(2014).
[23] E. Martinolli, M. Koenig, J. M. Boudenne, E. Perelli, D. Batani, T. A. Hall. Rev. Sci. Instrum., 75, 2024(2004).
[24] A. Authier, S. Lagomarsino, B. K. Tanner. X-ray and Neutron Dynamical Diffraction: Theory and Applications(1996).
[25] E. C. Harding, T. Ao, J. E. Bailey, G. Loisel, D. B. Sinars, M. Geissel, G. A. Rochau, I. C. Smith. Rev. Sci. Instrum., 86, 465(2015).
[26] T. Pikuz, A. Faenov, I. Skobelev, A. Magunov, L. Labate, L. Gizzi, G. Petrocelli. Laser and Particle Beams, 22, 289(2004).
[27] M. S. D. Rio, N. Perezocanegra, X. Shi, V. Honkimki, Z. Lin. J. Appl. Crystallogr., 48, 477(2015).
[28] M. S. del Rio. Proc. SPIE, 9209, 920905(2014).
[29] M. S. Schollmeier, G. P. Loisel. Rev. Sci. Instrum., 87, 123511(2016).
[30] M. S. Schollmeier, M. Geissel, J. E. Shores, I. C. Smith, L. Porter. Appl. Opt., 54, 5147(2015).
[31] K. Nakajima, K. Fujiwara, W. Pan, H. Okuda. Nat. Mater., 4, 47(2005).
[32] H. Okuda, K. Nakajima, K. Fujiwara, K. Morishita, S. Ochiai. J. Appl. Cryst., 41, 798(2008).
[33] H. Hiraka, K. Ohkubo, M. Furusaka, Y. Kiyanagi, K. Yamada, K. Morishita, K. Nakajima. Nucl. Instrum. Methods Phys. Res. Sec. A, 693, 166(2012).
[34] P. Pfeifer, Y. J. Wu, M. W. Cole, J. Krim. Phys. Rev. Lett., 62, 1997(1989).
[35] Y. Gong, S. T. Misture, P. Gao, N. P. Mellott. J. Phys. Chem. C, 120, 22358(2016).

Set citation alerts for the article
Please enter your email address
© Copyright 2018-2021 | Chinese Laser Press. All Rights Reserved 沪ICP备15018463号-20