
Young-Sung Park, Jieun Hong, Jaeho Choi. X-ray volumetric quantitative phase imaging by Foucault differential filtering with linear scanning[J]. Chinese Optics Letters, 2023, 21(1): 013401
- Chinese Optics Letters
- Vol. 21, Issue 1, 013401 (2023)
Abstract
1. Introduction
In radiography, the brightness of the transmitted light related to the distance of the focal plane from the specimen was used to image a specific inner plane of the laterally extended specimen[1]. Such a method has been renewed as computed laminography using a synchrotron radiation source[2–4] and the phase-contrast imaging method[5] to image transparent laterally extended shapes of objects. Phase imaging principally pertains to interferometric techniques that require high temporal and spatial coherence of the source; however, it is also allowed by non-interferometric methods with low coherence sources. A significant intensity alteration was observed for the transmission of the specimen at a certain distance. It arose from the refraction of X-rays due to the thickness of the specimen. This refraction phenomenon in X-rays leads to the report of the first observation, to the best of our knowledge, of propagation-based phase-contrast imaging in X-rays[6,7]. The images acquired objects located at a different distance inside the specimen, while rotating the specimen provided a reconstruction of quantitative phase images and giving rise to the mapping of 3D images based on the density of a specimen[8]. Non-interferometric methods may offer more stability than the interferometric method and a less technical demanding approach with a low coherence source. The transport-intensity equation (TIE), one of the non-interferometric schemes based on propagation wave field, i.e., the intensity derivative in the direction of wave propagation, has been studied[9,10]. Using the TIE, various studies such as the phase-retrieval method and optical sectioning imaging have been explored in optical spectra[11–15]. Similarly, non-interferometry X-ray phase detection has attempted to take advantage of the TIE[16–20]. Those results in the X-ray region cannot carry the coordinative results compared to the interferometric means until now. Developing non-interferometric phase reconstruction using the TIE and knife-edge scan imaging, especially for 3D X-ray image rendering, has considerable advantages and challenges because those non-interferometric methods are less restricted to the coherency of the source. This work designed the Foucault differential filtering (FDF) setup and performed a concurrent-bidirectional scanning of the Foucault knife-edge array (FKA). The biased derivative filtering (BDF) data were acquired by scanning the FKA for the plane, which was perpendicular to the optical axis at a given distance from the specimen. After that, the BDF data were acquired at every scanning point sequentially along the optical axis. Our imaging algorithm can use a simple arithmetic calculation for phase-retrieval processing because the intensities of BDF are connoted to the Fourier transform (FT). Hence, conventional image reconstruction techniques such as iterative algorithms or filtered back-projection methods do not require applying our volumetric rendering.
2. Methods and Experiment
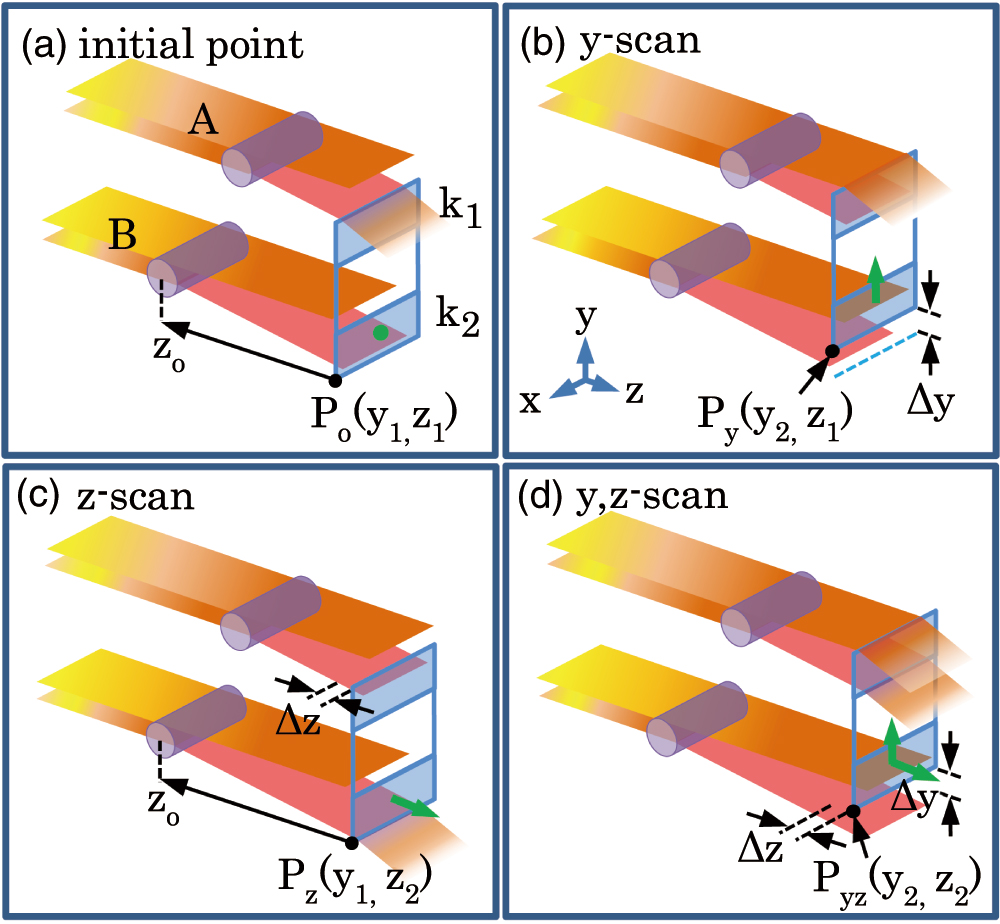
Figure 1 shows a conceptual diagram of the scheme of rendering sectioning images in the experimental setup of the FDF. Two internal objects (A, B) are embedded in dissimilar locations inside the specimen. These internal objects have a smaller difference in the refractive index than the matrix. Partially collimated X-ray beams by the pinhole array transmit through the specimen. The beams transmit through objects A and B, and then refract. Considering that two sheets of beams were illuminated on the object, one was transmitted through the object, and the other beam passed the outer boundary of the object. The object was set at position , and the FKA (k1, k2) was set at (), which is the initial point of scanning [Fig. 1(a)]. The refracted light sheet from object A at this position was filtered by the upper edge k1. Figure 1(b) shows the case of the -directional scanning. The FKA is moved along the positive direction from the initial position. After that, the transmitted light sheet was filtered by the upper knife-edge k1; however, the refracted light sheet is cut off by k1. The FKA (k2) could cut off the transmitted light sheet from object B, which passed through at . The -axis scanning at a given y1 position is not affected by the transmitted light sheets, which is shown as a comparison in Figs. 1(a),1(c) and 1(b),1(d). In these cases, the refracted light sheet from object A or B can be filtered by the KFA at different locations along the axis. Those filtered beams at different -axial positions of the knife-edge imply that object A or B can be identified at a specific location of the axis.
![]()
Figure 1.Conceptual diagram of the scheme of rendering sectioning images in the experimental setup of FDF. The incident X-ray beams (orange color) from the pinhole array lens (not depicted) pass through the specimen. A and B are objects inside the specimen. k1 and k2, the elements of the Foucault knife-edge (FKA). zo, the location of the objects. Pyz (yi, zj) is the position of the FKA element in terms of the y–z coordinates. The green dot and the green arrow represent the initial position of the scanning and the direction of the FKA movement, respectively.
While the FKA is moving in the positive (or ) directions, the upper (or right) knife edges of the Foucault knife-edge (FK) elements conducted positive scanning, and the lower (or left) knife edges performed negative scanning, concurrently. We call this process concurrent-bidirectional knife-edge filtering. Unlike conventional knife-edge scanning, scanning is performed in one direction. Nevertheless, the scanning direction and its opposite directional data also accumulated[21]. The corresponding intensities, i.e., BDF intensities for the plane can be acquired by conducting the concurrent-bidirectional knife-edge filtering for each -axial position.
Sign up for Chinese Optics Letters TOC. Get the latest issue of Chinese Optics Letters delivered right to you!Sign up now
The difference in the BDF intensities between the two points on the axis, i.e., was engaged in the TIE calculation process for the phase-contrast imaging.
The TIE that is given from the expression of conservation of energy in the propagating field is[22,23]
Therefore, the differentiation of the difference in BDF intensities of two planes along the optical axis can be written by TIE[24,25] as
An incoherent X-ray source used in the experiments was a Cu target () line focus X-ray tube with a focus size of and a power generator operated at 45.3 kV/8.0 mA. A lead aperture with a diameter of 3 mm on an 8-mm-thick plate was placed in front of the X-ray exit window. A gold grid 20 µm thick, used as a pinhole array lens (PAL), was mounted after the lead aperture. It had a period of 12.5 µm, where the hole width and bar width are 7.5 µm and 5.0 µm, respectively. The emitted incoherent X-ray beam passed through the PAL, which performed the functions of a 2D array lens to modulate it to partially coherent and condensing X-rays illuminating the object. Another gold grid was used as the FKA, with the opening area, bar width, active area, and thickness of , 5 µm, 3 mm in diameter, and approximately 20 µm, respectively. The FKA was placed at the back focal plane of the PAL. The length of the back focal plane of the FKA can be calculated using the formulation of the pinhole lens diameter versus the focal length, . For this case, the pinhole diameter was assumed to be 7.5 µm, and the wavelength of the X-rays was considered to be . Hence, the focal length , the distance from the PAL to FKA, was evaluated to be . The phase-contrast visibility of the experimental setup can be determined by the ratio of the shearing length to the spatial coherence length [26,27]. When the ratio () is less than one, the source is partially coherent, and the phase-contrast is visible. In our system, ; hence, phase imaging can be realized using the PAL. A similar configuration of the experimental setup is given in Ref. [28].
We chose the gills of a Poecilia reticulata fish, which appropriately provided a laminate microstructure object to depict the sectioning and volumetric images. The specimen, the gills of a Poecilia reticulata fish, consisting of four layers, was removed from its body. One of the gills was separated from the bunch for taking pictures using optical microscopy, and the rest of the three layers of gills were left in the bunch. All of them were naturally dried in air. It was mounted on the specimen holder, which is located at the front of the FKA. The distance () between the specimen and the FKA was adjusted until a clear absorption image was seen on the scintillator screen. The images became blurry because the refracted rays from the dissimilar positions of the object fell on a pixel when the distance was longer than 2 mm. The image was taken using an electron-multiplying charge coupled device (EMCCD, Princeton Instruments); it had pixels with a 150-µm-thick scintillation crystal (yttrium-aluminum-garnet: Ce), which was coupled with an optical microscope. The scintillation crystal was mounted at 3 mm following the FKA. The effective pixel size of the recorded images was with the use of the objective lens, which was used with the optical microscope. The spatial resolution of our imaging system can be determined to be 10 µm. While scanning along the positive direction of the and axes of the FKA was conducted, the intensities of the BDF images of the forward scanning and backward scanning are acquired, simultaneously. At the given position, the object has been scanned a total of 25 times (five steps for each axis) with 100 s of exposure per image. The numerical figures of the intensity differences were logged in a spreadsheet-type data format. For example, BDF intensities, and corresponding to the -axial position of the specimen, at and , respectively, were substituted to calculate the phase differentiation of the interval 0–20 µm. The phase recovery process for obtaining the -plane sectioning quantitative phase images was conducted by substituting the data sets into Eq. (3). The post-imaging process for the volume rendering and cross-sectional images was performed using ImageJ, which is a publicly available image processing program.
3. Results and Discussions
Figure 2(a) shows the optical microscopic image of the gills. The stacked layers of the gills had an overall thickness of , and the gill filaments were branched from the boomerang-shaped gill arches. The absorption X-ray image, which was the same as the conventional radiographic image, is presented in Fig. 2(b) to compare with X-ray quantitative phase imaging (XQPI). The information depth between the filaments was hard to obtain from this absorption image. A series of XQPI for the xy plane is shown in Fig. 2(c), which was reconstructed using the differentiation of the difference of BDF intensities data sets, which were acquired in every 20 µm scan interval along the axis.
![]()
Figure 2.Images of the gills of a Poecilia reticulata fish. (a) The optical microscopic image. (b) The X-ray absorption image of the gills. (c) Example of the X-ray quantitative phase images in the xy plane. 1, filaments; 2, arches; 3, anchors. The inset scale bar is 200 µm.
Subsequently, the volumetric rendering processing was performed using a Java-based open image processing program, presenting a 3D image of three-layer gills. Figure 3(a) shows a full-scale view of the volumetric rendering outcome of stacking 39-layer -plane sectioning XQPI, which has a field of view (FOV). The cross-sectional view of the filaments perpendicular to the lateral direction of the filament clearly distinguished the layer of gills, and it also identified the solidified secreted mucus layers between them [Fig. 3(b)]. Figure 3(c) (a green circle in the figure) shows an example of the connection node between the gill arches and the filaments. The image cut parallel to the longitudinal direction of filaments revealed some drooping filaments that could not be perceived from the -plane images. The region of interest (ROI) in the volumetric image showed enlarged arches and filaments of the gills in Fig. 4. The gill filament epithelium was covered with an undulated surface appearance. The nodes that connected the arch of the gill and filament are shown in Fig. 4(c). The solidified mucus layers between the gills presumed to be made with secreted mucus from the mucus cells on the filament surface are depicted in Figs. 4(c) and 4(d). The interconnection nodes of the filaments and the epithelium surface covering the gill arches [Fig. 4(c)] show the presence of many irregularly distributed protuberances.
![]()
Figure 3.Volumetric image by the stacked 39-layer xy-plane XQPI. (a) Full-scale view of the 3D rendering image. (b) The cross-sectional planes were perpendicular to the longitudinal direction of filaments. (c) The cut view along the filament direction. The node (the green circle) is shown.
![]()
Figure 4.Region of interest (ROI) in the volumetric image. (a) The yellow box is the represented ROI on the xy plane of the volumetric XQPI. (b) The white dot lines (L, M) in the enlarged view of ROI are the cut lines for (c) and (d). The red boxes in (c) and (d) show the cross-section views cut through to the z axis along the dot lines L and M. (c) The mucus layers were visualized in between the filaments. The cross-sectional view of the node on the filament end is shown. (d) The connections and nodes between the arch and the filament are shown.
The results presented here support the successful realization of XQPI by FDF using an incoherent source and merging with the TIE to obtain depth information without the rotational motion of a specimen or instrument. The concurrent-bidirectional scan scheme was demonstrated to acquire the positive and negative BDF intensities simultaneously. It reduces the scan number by half of its one-way scanning, which leads to the decreasing radiation damage to the specimens. The scanning area was FOV by transferring the FKA for five scan steps for each axis, 2.5 µm of a scanning interval.
Phase reconstruction with most other methods would be impaired by the low coherency of the source. However, the coherency effects of the source on the XQPI do not significantly contribute to our FDF owing to the nature of the knife-edge filtering scheme that is the groundwork of our experiment setup. The illumination of a coherent light source to a sample in the knife-edge filtering method causes the appearance of a binary cutoff and fringes on the images due to the attributed diffraction[29]. The FKA filtering itself performs the FT in a way of hardware. Hence, our FDF is not to be used with phase unwrapping or deconvolution during the post-imaging process. As a result of such a direct recovery process without FT, the quantitative phase image can be rendered without discontinuity, even though hard and soft materials are mixed in a sample. The FDF has a function that could be comparable to the confocal microscope in terms of producing sectioning and volumetric images. Hence, it could provide a wide range of applications including biomedical imaging and research in the field of materials[30]. It could be rendering volumetric XQPI for much thicker, even opaque, biopsy specimens or cultured tissue without cryostat sectioning or staining for clinical examination and pathological studies. The FDF method could be utilized in an imaging apparatus for the telescope, which may be able to obtain phase-contrast images for astronomical objects. The presented method provides a superior means to facilitate 3D phase-contrast imaging using conventional incoherent X-ray tube sources as well as other radiation sources that have a low coherence and low brilliance, such as neutrons[31].
References
[1] B. G. Ziedses des Plantes. Eine Neue Methode Zur Differenzierung in der Rontgenographie (Planigraphies). Acta Radiol., 13, 182(1932).
[2] L. Helfen, T. Baumbach, P. Mikulik, D. Kiel, P. Pernot, P. Cloetens, J. Baruchel. High-resolution three-dimensional imaging of flat objects by synchrotron-radiation computed laminography. Appl. Phys. Lett., 86, 071915(2005).
[3] K. Krug, L. Porra, P. Coan, A. Wallert, J. Dik, A. Coerdt, A. Bravin, P. Reischig, M. Elyyan, L. Helfen, T. Baumbach. Relics in medieval altarpieces? Combining X-ray tomographic, laminographic and phase-contrast imaging to visualize thin organic objects in paintings. J. Synchrotron Rad., 15, 55(2008).
[4] F. Xu, L. Helfen, A. J. Moffat, G. Johnson, I. Sinclairb, T. Baumbach. Synchrotron radiation computed laminography for polymer composite failure studies. J. Synchrotron Rad., 17, 222(2010).
[5] V. Altapova, L. Helfen, A. Myagotin, D. Hänschke, J. Moosmann, J. Gunneweg, T. Baumbach. Phase contrast laminography based on Talbot interferometry. Opt. Express, 20, 6496(2012).
[6] R. Gradl, M. Dierolf, L. Hehn, B. Günther, A. Ö. Yildirim, B. Gleich, K. Achterhold, F. Pfeiffer, K. S. Morgan. Propagation-based phase-contrast X-ray imaging at a compact light source. Sci. Rep., 7, 4908(2017).
[7] M. Krenkel, M. Töpperwien, C. Dullin, F. Alves, T. Salditt. Propagation-based phase-contrast tomography for high-resolution lung imaging with laboratory sources. AIP Adv., 6, 035007(2016).
[8] P. Cloetens, W. Ludwig, J. Baruchel, D. Van Dyck, J. Van Landuyt, J. P. Guigay. Holotomography: quantitative phase tomography with micrometer resolution using hard synchrotron radiation X rays. Appl. Phys. Lett., 75, 2912(1999).
[9] D. Paganin, A. Barty, P. J. McMahon, K. A. Nugent. Quantitative phase-amplitude microscopy. III. The effects of noise. J. Microsc., 214, 51(2004).
[10] C. Zuo, Q. Chen, A. Asundi. Transport of intensity equation: a new approach to phase and light field. Proc. SPIE, 9271, 92710H(2014).
[11] M. Krenkel, M. Bartels, T. Salditt. Transport of intensity phase reconstruction to solve the twin image problem in holographic X-ray imaging. Opt. Express, 21, 2220(2013).
[12] L. Tian, J. C. Petruccelli, Q. Miao, H. Kudrolli, V. Nagarkar, G. Barbastathis. Compressive X-ray phase tomography based on the transport of intensity equation. Opt. Lett., 38, 3418(2013).
[13] K. A. Nugent. X-ray image reconstruction using the transport of intensity equation. IPAP Conf. Series, 7, 399(2006).
[14] M. Broxton, L. Grosenick, S. Yang, N. Cohen, A. Andalman, K. Deisseroth, M. Levoy. Wave optics theory and 3-D deconvolution for the light field microscope. Opt. Express, 21, 25418(2013).
[15] M. Mitome. Transport of intensity equation method and its applications. Microscopy, 70, 69(2021).
[16] T. E. Gureyev, A. Roberts, K. A. Nugent. Partially coherent fields, the transport-of-intensity equation, and phase uniqueness. J. Opt. Soc. Am. A, 12, 1942(1995).
[17] M. Das, Z. Liang. Approximated transport-of-intensity equation for coded-aperture X-ray phase-contrast imaging. Opt. Lett., 39, 5395(2014).
[18] A. Snigirev, I. Snigireva, V. Kohn, S. Kuznetsov, I. Schelokov. On the possibilities of X-ray phase contrast microimaging by coherent high-energy synchrotron radiation. Rev. Sci. Instrum., 66, 5486(1995).
[19] K. A. Nugent, T. E. Gureyev, D. F. Cookson, D. Paganin, Z. Barnea. Quantitative phase imaging using hard X-rays. Phys. Rev. Lett., 77, 2961(1996).
[20] P. Cloetens, W. Ludwig, J. Baruchel, D. Van Dyck, J. Van Landuyt, J. P. Guigay, M. Schlenker. Holotomography: quantitative phase tomography with micrometer resolution using hard synchrotron radiation X-rays. Appl. Phys. Lett., 75, 2912(1999).
[21] J. Choi, Y.-S. Park. X-ray phase imaging microscopy with two-dimensional knife-edge filters. Appl. Phys. Express, 5, 042503(2012).
[22] M. R. Teague. Deterministic phase retrieval: a Green’s function solution. J. Opt. Soc. Am., 72, 1199(1982).
[23] M. R. Teague. Deterministic phase retrieval: a Green’s function solution. J. Opt. Soc. Am., 73, 1434(1983).
[24] J. P. Guigay, M. Langer, R. Boistel, P. Cloetens. Mixed transfer function and transport of intensity approach for phase retrieval in the Fresnel region. Opt. Lett., 32, 1617(2007).
[25] D. Paganin, K. A. Nugent. Noninterferometric phase imaging with partially coherent light. Phys. Rev. Lett., 80, 2586(1998).
[26] S.-A. Zhou, A. Brahme. Development of phase-contrast X-ray imaging techniques and potential medical applications. Phys. Med., 24, 129(2008).
[27] X. Wu, H. Liu. Clarification of aspects in in-line phase-sensitive X-ray imaging. Med. Phys., 34, 737(2007).
[28] J. Choi, Y.-S. Park. Enhanced quantitative X-ray phase-contrast images using Foucault differential filters. Chin. Opt. Lett., 15, 081103(2017).
[29] G. S. Settles. Schlieren and Shadowgraph Techniques: Visualizing Phenomena in Transparent Media(2001).
[30] F. Xu, L. Helfen, A. J. Moffat, G. Johnson, I. Sinclair, T. Baumbach. Synchrotron radiation computed laminography for polymer composite failure studies. J. Synchrotron Radiat., 17, 222(2010).
[31] F. Pfeiffer, C. Grünzweig, O. Bunk, G. Frei, E. Lehmann, C. David. Neutron phase imaging and tomography. Phys. Rev. Lett., 96, 215505(2006).

Set citation alerts for the article
Please enter your email address
© Copyright 2018-2021 | Chinese Laser Press. All Rights Reserved 沪ICP备15018463号-20