
Chaoyong Chen, Chunqing Gao, Huixing Dai, Qing Wang. Single-frequency Er:YAG ceramic pulsed laser with frequency stability close to 100 kHz[J]. Chinese Optics Letters, 2022, 20(4): 041402
- Chinese Optics Letters
- Vol. 20, Issue 4, 041402 (2022)
Abstract
1. Introduction
Frequency stabilization of remote coherent Doppler lidar or differential absorption lidar laser transmitters is essential for obtaining a high accuracy and a high signal-to-noise ratio (SNR)[
The PDH method was first, to the best of our knowledge, introduced in the pulse domain by Wulfmeyer in 2000, and a short-term frequency stability of 0.18 MHz root mean square (rms) at pulse repetition rate (PRR) of 200 Hz was reported[
In this paper, we demonstrated that the frequency instability of the single-frequency pulses can be controlled close to 100 kHz by following the PDH scheme. Compared with our previous work, we optimized the laser resonance cavity, the mechanical structure, and the feedback control system. The PRR can be set from 100 to 500 Hz with hundreds of nanoseconds pulse duration, the frequency stability varies from 82.72 kHz to 134.44 kHz and pulse energy from 9.84 mJ to 19.55 mJ. The beam quality factors of the output laser are 1.24 in the X direction and 1.21 in the Y direction, respectively. Besides, we analyzed the influence of pulse frequency stability on the SNR and measurement accuracy of the remote coherent Doppler lidar by means of numerical simulation, and the Allan variance of the frequency stability was also given.
Sign up for Chinese Optics Letters TOC. Get the latest issue of Chinese Optics Letters delivered right to you!Sign up now
2. Analysis
For the remote coherent Doppler lidar or differential absorption lidar, pulse accumulation or averaging is a very practical method to improve the detection accuracy and range. Here, we take the coherent Doppler wind lidar as an example and analyze the influence of pulse frequency stability on SNR and measurement accuracy of the lidar echo in detail by means of the numerical simulation.
The echo signal of the Doppler lidar is the superposition of a large number of aerosol particles’ backscattered signals, and the phase of the backscattered signal of each particle is randomly distributed, so the Doppler signal can be described by a zero-mean complex Gaussian process. According to Zrnic’s theory of weather Doppler signal simulation[
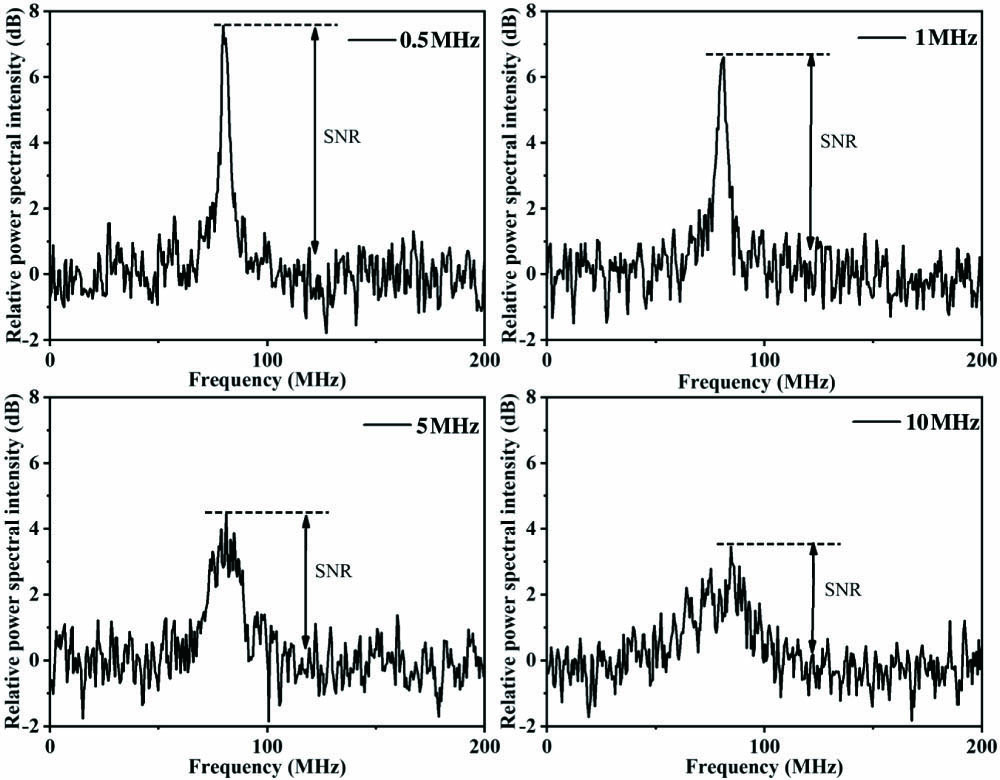
In order to simplify the simulation, we consider that only white noise affects the echo signal. The frequency jitter of each pulse is added to the Doppler shift. The frequency jitters are normally distributed. In order to visually see the impact of the pulse frequency stability on the SNR and measurement accuracy, we selected the standard deviation of frequency jitter as 0.5 MHz, 1 MHz, 5 MHz, and 10 MHz, and the relative power spectra of the echo signal are shown in Fig. 1.
![]()
Figure 1.Simulation of the Doppler lidar echo signals’ relative power spectrum data with pulse frequency stability of 0.5 MHz, 1 MHz, 5 MHz, and 10 MHz. The lidar emits Gaussian pulses with the wavelength of λ = 1645 nm, SNRsp = -10 dB, f = 80 MHz, 1/Ts = 500 MHz, ΔT = 200 ns, and the cumulative number of pulses is 100.
As shown in Fig. 1, the pulse frequency jitter has a great influence on the SNR after the pulse accumulation. The higher the stability of pulse frequency is, the higher the SNR of the Doppler lidar is. Another obvious feature is that the smaller the pulse frequency jitter, the narrower the spectral width of the Doppler signal and the sharper the peak value, which means the higher the accuracy of speed measurement.
3. Experimental Setup
The schematic diagram of our injection-seeded single-frequency Er:YAG laser is shown in Fig. 2. It consists of three main parts: a continuous wave seed laser, a -switched slave ring cavity, and an injection-seeding control system.
![]()
Figure 2.Experimental setup of a frequency stabilized, Q-switched 1645 nm ceramic Er:YAG laser based on the PDH method. NPRO, nonplanar ring oscillator seed laser; HWP, half-wave plate; EOM, electro-optic phase modulator; AOM, acousto-optic Q-switch; PZT, piezoelectric transducer; PID, proportional-integral-differential controller; RPD, resonant photo-detector.
A symmetrical and compact slave ring cavity, which is composed with eight cavity mirrors (from M1 to M8), is adopted in our experiment for improving the stability and the beam quality. The designed total cavity length is about 2.2 m for meeting the requirements of the remote coherent Doppler lidar regarding pulse width. M1, M2, M7, and M8 are dichroic mirrors with a transmittance of more than 95% at 1470 nm and a reflectance of more than 99.5% at 1645 nm. Both M3 and M5 are plano-concave mirrors with a radius of curvature of 1000 mm. The difference is that M3 is an output mirror with a transmittance of 20% at 1645 nm, while M5 is a high-reflection mirror at 1645 nm. M4 and M5 are plane high-reflection mirrors at 1645 nm. Unlike our previous designs, the piezoelectric transducer (PZT) and mirror M4 are pressed together by a mechanical structure rather than glued together, with a rubber ring between them. Then, a pre-stressing force is applied to the PZT. This method effectively avoids the reduction of the PZT mechanical resonance frequency caused by gluing, and it ensures that the PZT can not only push M4 to change the cavity length but also maintain sufficient response bandwidth. Two continuous wave 1470 nm fiber coupled diode lasers (Pump 1 and Pump 2) pump two 0.25% (atomic fraction) doped, Er:YAG ceramic rods. The fiber core diameters are 200 µm, and the numerical apertures are 0.22. The pump beams are mode matched with the slave cavity by two pairs of lenses with the focal lengths of 30 mm and 125 mm, respectively. The radii of the pumping beams in the Er:YAG rods center are about 420 µm, which are about 0.95 times the radius of the laser beams within the crystals. The Er:YAG rods are encased in a copper heat sink and temperature controlled by thermal electric coolers (TECs) to 18ºC.
The single-frequency seed laser is generated by a 1470 nm laser diode pumped monolithic Er:YAG crystal nonplanar ring oscillator (NPRO) with a linewidth of 8 kHz[
The control system and control process of our experimental setup are shown in Fig. 2(b). Firstly, a triangular wave sweep signal with a frequency of 100 Hz is loaded onto the PZT via the PZT driver. At this time, the cavity length of the slave resonant cavity is periodically modulated. M10, L4, and M11 are fine-tuned to match the pattern of the seed laser and the slave cavity. If the patterns matches well, the DC terminal of the resonant photo-detector (RPD) will output a periodic, smooth resonance signal[
What is more, the laser is encapsulated in a sealed aluminum shell to isolate external vibrations such as sound, air flow, and human activities.
4. Results and Discussion
When the pump power was 72 W, the free-running slave cavity laser produced a bidirectional 1645 nm continuous wave laser output of up to 6.4 W, which was tested by a power meter (PM100D/S314C, Thorlabs). At the injection-seeding operation, the average energies of the single-frequency pulses were 19.55 mJ, 16.99 mJ, 13.67 mJ, 11.19 mJ, and 9.84 mJ at PRRs of 100 Hz, 200 Hz, 300 Hz, 400 Hz, and 500 Hz, respectively. The energy of each pulse was measured by an energy meter (1919-R, Newport), and 10,000 pulses were recorded at each PRR, as shown in Fig. 3. According to the statistical results, the relative energy instability of pulses is approximately 0.5%, which shows that the pulse energy has good stability.
![]()
Figure 3.Pulse energies at different PRRs of 100 Hz, 200 Hz, 300 Hz, 400 Hz, and 500 Hz.
By performing coherent heterodyning of the seed laser and pulsed laser, we verified the single-frequency characteristics of the output pulses and obtained the stability of the center frequency of the pulses. Figures 4(a) and 4(b) show a single-shot beat note signal and its fast Fourier transform (FFT) at the PRR of 300 Hz. The pulse spectrum width of Gaussian fitting is 1.77 MHz. Figure 4(c) shows a single-frequency pulse with a pulse width of 273.4 ns. The smooth pulse shape and perfect beat signal illustrate the single-frequency characteristic of the pulsed laser.
![]()
Figure 4.(a) Single-shot beat note signal and (b) its FFT at the PRR of 300 Hz. (c) Single-frequency pulse waveform diagram.
![]()
Figure 5.Recorded center frequencies of the beat note signals (left) and their distributions (right) at different pulse repetition frequencies of 100 Hz, 200 Hz, 300 Hz, 400 Hz, and 500 Hz.
A 400 MS/s sampling rate data acquisition card was used to record the beat note signals, and we obtained the center frequency of the beat note signals by the FFT algorithm. As shown in Fig. 5, 10,000 center frequencies of the beat note signals and their distributions at each PRR from 100 Hz to 500 Hz were recorded. The standard deviations of the central frequencies at different PRRs from 100 Hz to 500 Hz are 82.72 kHz, 95.18 kHz, 115.32 kHz, 130.52 kHz, and 134.44 kHz, respectively. All center frequencies of the beat note signals follow the normal distribution nicely, which indicates that the unstable factors of pulse frequency are mainly random events. In the injection-seeding technique, the longitudinal mode closest to the seed’s frequency is preferentially oscillated, and the other longitudinal modes are suppressed, resulting in a single-frequency pulse. Because the effective cavity lengths are different at different PRRs, which are caused by the thermal effect, the center frequencies of the beat note signal at different PRRs are also different.
Compared with the standard deviation, which is only convergent for white noise[
![]()
Figure 6.Allan plot for pulse frequencies at different PRRs.
The beam quality of the single-frequency pulses was detected by a beam profiling camera (Pyrocam IIIHR, Ophir Optronics Solutions Ltd.). Figure 7 shows the change of beam diameter with relative position at the PRR of 300 Hz, where the beam is focused by a convex lens with a focal length of 500 mm. Fitting the beam widths by a hyperbola line, the factors are calculated to be 1.24 and 1.21 in the X and Y directions, respectively. Thanks to the symmetrical pumping structure and the very small incident angle on the concave mirrors M3 and M5, the output laser beam has almost no astigmatism.
![]()
Figure 7.Beam quality of the single-frequency pulses at the PRR of 300 Hz.
5. Conclusion
The PDH scheme also has a good performance in the injection-seeded pulse domain that was demonstrated. The frequency stability of an injection-seeded single-frequency 1645 nm pulsed laser can be controlled close to 100 kHz. It may be a good technical verification for the future space-based lidars. The single-frequency pulse energy varies from 9.84 mJ to 19.55 mJ with a relative energy instability of approximately 0.5% at the PRR from 100 Hz to 500 Hz. The output pulses also have a beam quality with factors of 1.24 in the X direction and 1.21 in the Y direction, respectively. What is more, the influence of pulse frequency jitter on SNR and measurement accuracy of lidar was also analyzed.
References
[1] V. Wulfmeyer, M. Randall, A. Brewer, R. M. Hardesty. 2-µm Doppler lidar transmitter with high frequency stability and low chirp. Opt. Lett., 25, 1228(2000).
[2] Y. Zhu, J. Yang, X. Chen, X. Zhu, J. Zhang, S. Li, Y. Sun, X. Hou, D. Bi, L. Bu, Y. Zhang, J. Liu, W. Chen. Airborne validation experiment of 1.57-µm double-pulse IPDA LIDAR for atmospheric carbon dioxide measurement. Remote Sens., 12, 1999(2020).
[3] N. Cezard, S. Le Mehaute, J. Le Gouet, M. Valla, D. Goular, D. Fleury, C. Planchat, A. Dolfi-Bouteyre. Performance assessment of a coherent DIAL-Doppler fiber lidar at 1645 nm for remote sensing of methane and wind. Opt. Express, 28, 22345(2020).
[4] X. Zhu, J. Liu, D. Bi, J. Zhou, W. Diao, W. Chen. Development of all-solid coherent Doppler wind lidar. Chin. Opt. Lett., 10, 012801(2012).
[5] W. Diao, X. Zhang, J. Liu, X. Zhu, Y. Liu, D. Bi, W. Chen. All fiber pulsed coherent lidar development for wind profiles measurements in boundary layers. Chin. Opt. Lett., 12, 072801(2014).
[6] Z. Bu, S. Chen, Y. Zhang, H. Chen, X. Ge, P. Guo. Effect of laser pulse shape and duration on spectrum width of coherent LIDAR. Chin. Opt. Lett., 12, S12801(2014).
[7] X. Sun, J. Liu, J. Zhou, W. Chen. Frequency stabilization of a single-frequency all-solid-state laser for Doppler wind lidar. Chin. Opt. Lett., 6, 679(2008).
[8] J. Caron, Y. Durand. Operating wavelengths optimization for a spaceborne lidar measuring atmospheric CO2. Appl. Opt., 48, 5413(2009).
[9] F. Gibert, D. Edouart, C. Cénac, F. Le Mounier. 2-µm high-power multiple-frequency single-mode Q-switched Ho:YLF laser for DIAL application. Appl. Phys. B, 116, 967(2014).
[10] P. Kucirek, A. Meissner, S. Nyga, J. Mertin, M. Höfer, H.-D. Hoffmann. A single-frequency Ho:YLF pulsed laser with frequency stability better than 500 kHz. Proc. SPIE, 10082, 100821K(2017).
[11] O. Lux, D. Wernham, P. Bravetti, P. McGoldrick, O. Lecrenier, W. Riede, A. D’Ottavi, V. De Sanctis, M. Schillinger, J. Lochard, J. Marshall, C. Lemmerz, F. Weiler, L. Mondin, A. Ciapponi, T. Kanitz, A. Elfving, T. Parrinello, O. Reitebuch. High-power and frequency-stable ultraviolet laser performance in space for the wind lidar on Aeolus. Opt. Lett., 45, 1443(2020).
[12] F. Shen, Z. Wang, Y. Xia, B. Wang, P. Zhuang, C. Qiu. Quad-Fabry–Perot etalon based Rayleigh Doppler lidar for 0.2-60 km altitude wind, temperature and aerosol accurate measurement. Optik, 236, 166668(2021).
[13] J. Du, Y. Sun, D. Chen, Y. Mu, M. Huang, Z. Yang, J. Liu, D. Bi, X. Hou, W. Chen. Frequency-stabilized laser system at 1572 nm for space-borne CO2 detection LIDAR. Chin. Opt. Lett., 15, 031401(2017).
[14] L. A. Rahn. Feedback stabilization of an injection-seeded Nd:YAG laser. Appl. Opt., 24, 940(1985).
[15] S. W. Henderson, E. H. Yuen, E. S. Fry. Fast resonance-detection technique for single-frequency operation of injection-seeded Nd:YAG lasers. Opt. Lett., 11, 715(1986).
[16] Y. Zhang, C. Gao, Q. Wang, Q. Na, M. Zhang, M. Gao, S. Huang. 1 kHz single-frequency, injection-seeded Er:YAG laser with an optical feedback. Chin. Opt. Lett., 17, 031402(2019).
[17] C. E. Hamilton. Single-frequency, injection-seeded Ti:sapphire ring laser with high temporal precision. Opt. Lett., 17, 728(1992).
[18] A. Sträßer, T. Waltinger, M. Ostermeyer. Injection seeded frequency stabilized Nd:YAG ring oscillator following a Pound–Drever–Hall scheme. Appl. Opt., 46, 8358(2007).
[19] M. Ostermeyer, T. Waltinger, M. Gregor. Frequency stabilization of a Q-switched Nd:YAG laser oscillator with stability better 300 kHz following an rf-sideband scheme. Opt. Commun., 282, 3302(2009).
[20] F. Gibert, D. Edouart, C. Cénac, F. Le Mounier, A. Dumas. 2-µm Ho emitter-based coherent DIAL for CO2 profiling in the atmosphere. Opt. Lett., 40, 3093(2015).
[21] C. Chen, Q. Wang, S. Huang, X. Zhang, K. Wang, M. Gao, C. Gao. Single-frequency Q-switched Er:YAG laser with high frequency and energy stability via the Pound–Drever–Hall locking method. Opt. Lett., 45, 3745(2020).
[22] D. S. Zrnic. Estimation of spectral moments for weather echoes. IEEE Trans. Geosci. Electron., 17, 113(1979).
[23] R. Frehlich, M. Yadlowsky. Performance of mean-frequency estimators for Doppler radar and lidar. J. Atmos. Ocean. Technol., 11, 1217(1994).
[24] Y. Zheng, C. Gao, R. Wang, M. Gao, Q. Ye. Single frequency 1645 nm Er:YAG nonplanar ring oscillator resonantly pumped by a 1470 nm laser diode. Opt. Lett., 38, 784(2013).
[25] C. Chen, Z. Li, X. Jin, Y. Zheng. Resonant photodetector for cavity- and phase-locking of squeezed state generation. Rev. Sci. Instrum, 87, 103114(2016).
[26] D. W. Allan. Statistics of atomic frequency standards. Proc. IEEE, 54, 221(1966).

Set citation alerts for the article
Please enter your email address
© Copyright 2018-2021 | Chinese Laser Press. All Rights Reserved 沪ICP备15018463号-20