
Sungchul Kim, Evgenii Kim, Eloise Anguluan, Jae Gwan Kim. Sample entropy analysis of laser speckle fluctuations to suppress motion artifact on blood flow monitoring[J]. Chinese Optics Letters, 2022, 20(1): 011702
- Chinese Optics Letters
- Vol. 20, Issue 1, 011702 (2022)
Abstract
1. Introduction
Laser speckle imaging (LSI) is an imaging technique that provides blood flow information[
The speckle pattern, a product of the scattering and interference of coherent light with small particles, is constant in a static medium but fluctuates when scattering is dynamically changed by particle movement. For blood flow monitoring, the moving particles are the red blood cells. Observing changes in the speckle pattern allows us to monitor the relative blood flow changes either temporally or spatially by calculating or , respectively[
Despite being considered a standard to monitor flow velocity changes, this simple statistics-based calculation is often riddled with noise such as motion artifacts, making the analysis difficult. Sudden movement changes the laser speckle pattern and produces spikes in , disturbing the blood flow information. Those motion artifacts can be reduced by a low pass or bandpass filter after calculating [
Sign up for Chinese Optics Letters TOC. Get the latest issue of Chinese Optics Letters delivered right to you!Sign up now
Laser speckle fluctuations have higher contrast (highly different values) during slow compared to fast motion, where speckle patterns are more blurred (similar values). Thereby, entropy, as an index associated with the amount of information in a system, can be an indicator of changes in the flow rate based on the quantity of the speckle fluctuations. Recently, Miao et al. introduced a balanced entropy estimator as an alternative method to on monitoring blood flow changes[
2. Materials and Methods
This study used sample entropy (SampEn) instead of a balanced entropy estimator since bias and statistical error must be considered when using an entropy estimator[
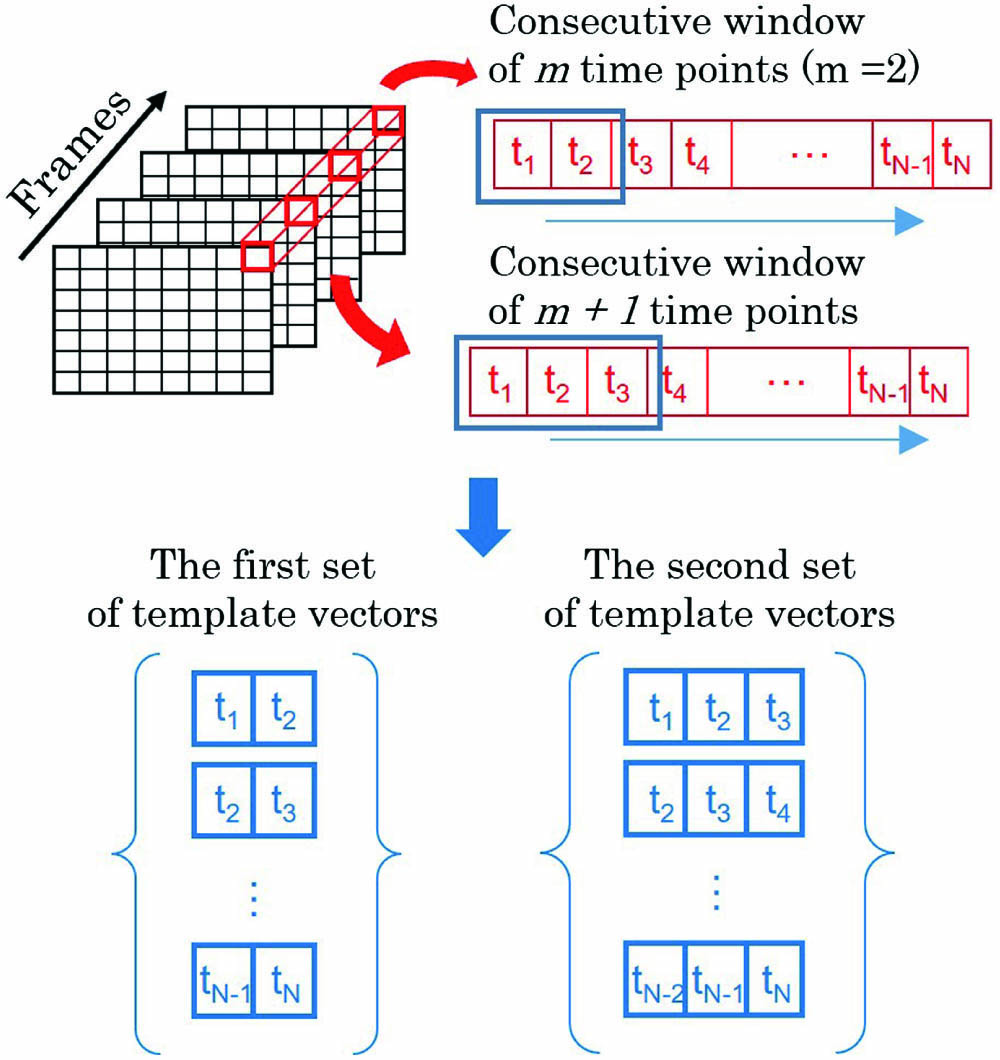
In the SampEn calculation, two sets of template vectors are generated from the input time series. The first set of template vectors is generated from the time series by taking each consecutive window of time points. The second set is generated in the same manner using time points. We then compare all pairs of template vectors within each set and count the number of defined similarities (similar if the difference between two vectors ) at each set, represented by and . is the sum of the similarities between the th template vector and all other template vectors, without counting the similarity itself. The similarity takes the value of zero if any element-wise difference between two template vectors is above the threshold and one if they are below the threshold. SampEn is then taken as the negative natural logarithm of the conditional probability that the defined similarities in the first set of template vectors remain in the second set. Figure 1 shows a schematic of how SampEn is obtained from laser speckle images. A more detailed discussion on the calculation of SampEn can be found in the work of Costa et al.[
![]()
Figure 1.Schematic diagram of the SampEn calculation sequence for LSI images.
We can expect that SampEn can quantify changes in blood flow because the fluctuations of speckle intensity result in variations in the similarity between neighboring time points depending on the distribution of temporal speckle intensity. A smaller distribution of temporal speckle intensity results in more similar points. To compensate for changes in light intensity, we define an index based on SampEn as follows:
With an index based on SampEn, the calculation of is expected to provide the relative blood flow changes similar to the conventional .
Furthermore, we hypothesized that would be less affected by motion artifacts than due to the nature of the SampEn calculation. When speckle intensity at a time point is significantly different from the neighboring speckle intensity values, the difference generates a large standard deviation, which produces a substantial change in values. However, SampEn defines similarities and only counts the number of occurrences of these similarities. An abrupt change in intensity would have little to no consequence since a pair of template vectors that have a difference greater than would still take a value of zero regardless of the difference.
In this study, we used a lab-built LSI system consisting of a 660 nm laser (LDCU5/A510, Power Technology, USA) and a camera (Prime, Photometrics, USA) with a macro lens (Zoom 7000, Navitar, USA). Images having pixels were acquired at 65 frames per second with 5 ms integration time. The experiments were performed in a quiet room without air movement to avoid any other sources of noise[
To show the applicability of on flow monitoring, a flow phantom experiment was designed, in which laser speckle changes can occur within controlled conditions. The phantom in the shape of a cylinder (diameter: 5.5 cm, height: 3.5 cm) was fabricated by using a mixture of polydimethylsiloxane (PDMS, SYLGARDTM 184 Silicone Elastomer Kit, Dow Corning, USA), India ink (0.16 g/L), and titanium dioxide powder (0.64 g/L), and then a transparent silicon tube (inner diameter: 3 mm, outer diameter: 7 mm) was inserted 5 mm beneath the phantom surface. The tube was filled with 2.5 mm diameter plastic beads to create a dynamic direction of moving scatterers when intralipid flows through the tube[
To validate our hypothesis that would be less affected by motion artifacts than , additional experiments were carried out on the human palm. The experiments contain arm occlusion induced by cuff inflation to 240 mmHg pressure on the upper arm to reach physiologically zero blood flow and movement of the wrist to add motion artifacts. In this experiment, the camera focused on the palm and continuously recorded the speckle images for 60 s baseline, 90 s arm occlusion, and 150 s recovery from the occlusion. Subjects were asked to move their hand upward rapidly once every 20 s during the arm occlusion.
3. Results
Figure 2(a) compares the and SampEn of speckle fluctuations during 0.1 mL/min increments of the flow rate from the flow phantom experiments. Each point is the average of 60 index values calculated at a constant flow rate for each incremental step. To calculate the index values , SampEn, , and , a region of interest (ROI) was selected on the phantom surface perpendicular to the silicon tube using a 10 by 10 pixel window. An index value is computed from the pixel time series (, 1 s sampling period) and averaged over this window. The threshold and template length were set to and 2, respectively, in the SampEn calculation. Both SampEn and decreased exponentially as the flow rate increased. A direct relationship to flow rates becomes apparent by using and [Fig. 2(b)]. Both parameters show a linear relationship () with flow rate changes.
![]()
Figure 2.Comparison of speckle contrast and SampEn calculations from phantom flow experiments. (a) Both σt and SampEn show a similar exponential decrease with increasing flow rate. (b) Incorporating the 〈I〉 in the calculation of speckle contrast (1/Kt2) and SampEn contrast (1/KSE2) results in a linear relationship with the rate of flow, as well as a greater range of values for SampEn contrast. (Each point is an average of 60 values taken over 1 min at a constant flow rate. Error bars indicate the standard deviation.)
To calculate SampEn, three input parameters are required: the time series data, the threshold for defining similarity (), and the length of the template (). In this study, we matched the length of the time series to the maximum number of frames per second () of the camera, a period considered sufficient to monitor relevant changes in blood flow during an arm cuff occlusion. Using a shorter length of time series (with or 45) also showed similar results (data are not shown).
The most critical input parameter in calculating SampEn turned out to be the threshold value, , as can be seen in Fig. 3(a). From the flow phantom experiments, we found that the high level of threshold loses linearity [Fig. 3(a)], but too low values of the threshold (less than ) blow up the value (data are not shown). Thus, we fix the value of the threshold to for the SampEn calculations of each window during the experiment.
![]()
Figure 3.(a) Normalized 1/KSE2 from flow phantom experiments depending on the various threshold values r. Threshold values were determined by multiples of the standard deviation of the first 65 recorded speckle intensity values where m is two. (b) The values of average and standard deviation of 1/KSE2 when the window length (m) changes from 2 to 4, where r is std*0.5.
Figure 3(b) shows that is less dependent on the number of consecutive data points . The results are all similar when is 2, 3, and 4. However, a large value of (greater than two) increases the likelihood of dissimilarity, since the condition for similarity becomes strict, causing SampEn to blow up when is too small. Thus, we used the number of consecutive data points of two.
Blood flow maps using and were generated from the arm occlusion experiments by calculating the respective contrast for each pixel over a 1 s period () (Fig. 4). The region was selected from a relatively flat part of the lower palm with a 150 by 190 pixel window. During arm occlusion, and calculated maps turned a darker blue due to blood flow decrease. After releasing the cuff pressure, the contrast maps immediately changed to a yellowish color corresponding to a sudden increase of blood flow and later gradually recovered to blue. The blood flow map using shows values close to zero when motion artifacts are induced, whereas the blood flow map using shows relatively similar values to the map before motion artifacts are induced. As seen in the blurred raw image, motion artifacts cause abrupt changes in the detected laser intensity, resulting in a large standard deviation () in the time domain speckle contrast. This makes the values close to zero because is inversely proportional to a square of .
![]()
Figure 4.Representative blood flow maps during the baseline, arm occlusion, motion, overshooting period, and recovery. Blood flow maps are generated from 1/KSE2 (left) and 1/Kt2 (middle), and raw images are shown in the right column.
Figure 5 shows blood flow changes over time during the upper arm occlusion experiment in three subjects. Results were taken from the average of single-pixel calculations in a 10 by 10 pixel area at the central part of the region, as shown in Fig. 4. Using both speckle contrast and SampEn methods, the blood flow dramatically drops after cuff inflation, followed by a steady low value during the arm occlusion. After releasing the cuff pressure, the blood flows overshoot and then slowly returns to baseline. Overall, the results from both and calculations showed similar trends, but there was an apparent difference when subjects moved their hand during arm occlusion. In the trace, four dips corresponding to the subject’s hand movements were clearly observed at 80, 100, 120, and 140 s. On the other hand, the SampEn contrast traces showed smaller ripples and were much less affected by motion. This result proves that SampEn contrast is more strongly immune to motion artifacts caused by sudden patient movement.
![]()
Figure 5.Blood flow during arm occlusion accompanied by sudden hand movements from three different subjects (each row). The dashed region indicates the period of occlusion.
The different appearances of motion artifacts in the and traces are due to different influences of the abrupt change during the calculation. As explained earlier, immediately dropped when the subject moved their hand upward due to a large increase in , which came from the immediate change in the detected laser intensity. Compared to , only slightly ripples from the change of average intensity, since SampEn with appropriately chosen parameters does not register the abrupt change.
Figure 6 shows the post-processed traces from by applying a low pass filter with various cutoff frequencies (Fc). The results showed that the lower the cutoff frequency, the less pronounced the effect of motion artifacts, but the abrupt changes in blood flow were underestimated. Figure 6(b) shows that blood flow change with a lower cutoff frequency misses the rapid change in blood flow during the inflation of the cuff. The application of the low pass filter also introduced a shape distortion in the time trace for lower cutoff frequencies, which could be mistaken for actual flow rate changes, as shown in Fig. 6(c). The graph shows that as the cutoff frequency is lower, the amplitude of dips decreases, but the dip becomes wider.
![]()
Figure 6.(a) Blood flow estimates using 1/KSE2 and post-processed 1/Kt2 with varying cutoff frequencies. (b) Magnified trace of the rapid blood flow change during cuff inflation. (c) Magnified trace of the motion artifact induced change. Traces were offset in the y axis to highlight the difference.
4. Discussion and Conclusion
In addition, to highlight the advantage of SampEn, which provides blood flow information while suppressing motion artifacts in real time, a study comparing performance with other motion artifact suppression methods will be needed.
There is a limitation in this study in that the SampEn contrast approach lacks a theoretical background to fully explain the relation between SampEn and speckle fluctuations induced by moving particles. However, as a practical model, this new approach to speckle contrast calculation has the main advantage of not requiring post-processing, such as applying a low pass filter to eliminate motion artifacts. Real-time blood flow monitoring immune to motion artifact will be crucial for clinical applications because applying a low pass filter reduces the sensitivity of detecting rapid changes in blood flow and delays the real-time display of blood flow.
Even though SampEn shows potential as an alternative method for speckle contrast in this study, future research on the relation of SampEn to light scattering theory is required to understand how the monitoring of SampEn can provide the information of blood flow. We believe that the study of blood flow monitoring using SampEn, which is now in its infancy, can become a powerful tool as it evolves into more sophisticated models, along with studies considering static/dynamic scatterers or comparing more advanced systems such as diffuse correlation spectroscopy (DCS).
LSI systems like most other physiological signal monitoring devices are susceptible to motion artifacts. Several studies tried to correct motion artifacts[
In conclusion, we applied SampEn analysis to temporal speckle intensity fluctuations in monitoring flow changes. The resulting blood flow index based on SampEn, is directly proportional to the changes in flow velocity similar to the conventional In-vivo upper arm occlusion experiments showed that is much less susceptible to motion artifacts from sudden wrist movements than . These results suggest that can be very useful in monitoring blood flow compared to speckle contrast when motion during measurements is inevitable.
References
[1] P. G. Vaz, A. Humeau-Heurtier, E. Figueiras, C. Correia, J. Cardoso. Laser speckle imaging to monitor microvascular blood flow: a review. IEEE Rev. Biomed. Eng., 9, 106(2016).
[2] D. A. Boas, A. K. Dunn. Laser speckle contrast imaging in biomedical optics. J. Biomed. Opt., 15, 011109(2010).
[3] J. D. Briers. Laser speckle contrast imaging for measuring blood flow. Opt. Applicata, 37, 139(2007).
[4] K. Basak, M. Manjunatha, P. K. Dutta. Review of laser speckle-based analysis in medical imaging. Med. Biol. Eng. Comput., 50, 547(2012).
[5] A. Khalil, A. Humeau-Heurtier, G. Mahé, P. Abraham. Laser speckle contrast imaging: age-related changes in microvascular blood flow and correlation with pulse-wave velocity in healthy subjects. J. Biomed. Opt., 20, 051010(2014).
[6] P. Miao, Z. Chao, Y. Zhang, N. Li, N. V. Thakor. Entropy analysis reveals a simple linear relation between laser speckle and blood flow. Opt. Lett., 39, 3907(2014).
[7] J. A. Bonachela, H. Hinrichsen, M. A. Munoz. Entropy estimates of small data sets. J. Phys. A, 41, 202001(2008).
[8] M. Costa, A. L. Goldberger, C.-K. Peng. Multiscale entropy analysis of biological signals. Phys. Rev. E, 71, 021906(2005).
[9] J. S. Richman, J. R. Moorman. Physiological time-series analysis using approximate entropy and sample entropy. Am. J. Physiol. Heart Circ. Physiol., 278, H2039(2000).
[10] M. Costa, A. L. Goldberger, C.-K. Peng. Multiscale entropy analysis of complex physiologic time series. Phys. Rev. Lett., 89, 068102(2002).
[11] G. Mahé, S. Durand, A. Humeau, G. Leftheriotis, P. Rousseau, P. Abraham. Air movements interfere with laser speckle contrast imaging recordings. Lasers Med. Sci., 27, 1073(2012).
[12] R. Bi, J. Dong, K. Lee. Deep tissue flowmetry based on diffuse speckle contrast analysis. Opt. Lett., 38, 1401(2013).
[13] M. Seong, Z. Phillips, P. M. Mai, C. Yeo, C. Song, K. Lee, J. G. Kim. Simultaneous blood flow and blood oxygenation measurements using a combination of diffuse speckle contrast analysis and near-infrared spectroscopy. J. Biomed. Opt., 21, 027001(2016).
[14] S. M. White, M. Valdebran, K. M. Kelly, B. Choi. Simultaneous blood flow measurement and dermoscopy of skin lesions using dual-mode dermascope. Sci. Rep., 8, 16941(2018).
[15] R. Selvan, P. Parthasarathi, S. S. Iyengar, S. Ananthamurthy, S. Bhattacharya. Estimation of membrane bending modulus of stiffness tuned human red blood cells from micropore filtration studies. PLoS ONE, 14, e0226640(2019).
[16] A. S. Abdurashitov, V. V. Lychagov, O. A. Sindeeva, O. V. Semyachkina-Glushkovskaya, V. V. Tuchin. Histogram analysis of laser speckle contrast image for cerebral blood flow monitoring. Front. Optoelectron., 8, 187(2015).
[17] B. Lertsakdadet, C. Dunn, A. Bahani, C. Crouzet, B. Choi. Handheld motion stabilized laser speckle imaging. Biomed. Opt. Express, 10, 5149(2019).
[18] B. Lertsakdadet, B. Y. Yang, C. E. Dunn, A. Ponticorvo, C. Crouzet, N. Bernal, A. J. Durkin, B. Choi. Correcting for motion artifact in handheld laser speckle images. J. Biomed. Opt., 23, 036006(2018).
[19] G. Mahé, P. Rousseau, S. Durand, S. Bricq, G. Leftheriotis, P. Abraham. Laser speckle contrast imaging accurately measures blood flow over moving skin surfaces. Microvasc. Res., 81, 183(2011).
[20] L. M. Richards, E. L. Towle, D. J. Fox, A. K. Dunn. Intraoperative laser speckle contrast imaging with retrospective motion correction for quantitative assessment of cerebral blood flow. Neurophotonics, 1, 015006(2014).
[21] X. Liu, J. Wei, L. Meng, W. Cheng, X. Zhu, J. Lu, P. Li. Motion correction of laser speckle imaging of blood flow by simultaneous imaging of tissue structure and non-rigid registration. Opt. Lasers Eng., 140, 106526(2021).

Set citation alerts for the article
Please enter your email address
© Copyright 2018-2021 | Chinese Laser Press. All Rights Reserved 沪ICP备15018463号-20