
Xitian Hu, Li Zhou, Xu Wu, Yan Peng. Review on near-field detection technology in the biomedical field[J]. Advanced Photonics Nexus, 2023, 2(4): 044002
- Advanced Photonics Nexus
- Vol. 2, Issue 4, 044002 (2023)
Abstract
Keywords
1 Introduction
Microscopic biological objects, including biomacromolecules, cells, and micro-organisms, are the basic components of life, with sizes ranging from tens of nanometers to tens of micrometers. Accurate detection for microscopic biological objects is a powerful tool for studying physiological processes and exploring the development process of diseases. It can improve the understanding of immune processes and metabolic processes. For example, multiple protein/molecular markers are used to distinguish the specific phenotypes of microglia, including pro-inflammatory M1 and anti-inflammatory M2,1 and to study their function and tissue status. The continuous activation of M1 microglia will damage the peripheral nerve cells, which may lead to neurogenerative diseases. The studies based on microglia can provide a new perspective for the study of the mechanism of neuroinflammation. Therefore, at the microlevel, sensitive and accurate biomedical detection techniques are critical to the prediction and the treatment of disease. According to the detection resolution, the detection techniques for microscopic biological objects can be roughly divided into two categories: one with a resolution of the order of micrometers, and the other with a resolution of the order of nanometers. These two types of detection techniques are discussed separately.
1.1 Methods with Lateral Resolution at the Micrometer Level
1.1.1 Chemical staining
Chemical dyes are used to react with specific biological target and stain them, such as using Giemsa staining to observe chromosomes under an optical microscope. The staining method is easy to operate, and the result can be obtained by direct observation of the microscope. However, the resolution will be limited by the light diffraction. According to the Abbe diffraction limit formula, the resolution of the optical microscope is about half of the wavelength. Considering that the range of visible light is from 380 to 780 nm, the resolution limit of the visible light optical microscope is about 200 nm, which is difficult to observe biological structures at the nanoscale.
1.1.2 Labeling method
In the labeling method, label molecules (such as fluorescence and isotopes) are often used to participate and track changes in physiological reactions. The use of labeling methods enables high-sensitivity molecular detection, but the addition of markers may change the original molecular structure, composition, or biological environment. Therefore, it cannot truthfully reflect the true state of the biomedical samples in the original environment and the limited luminescence time of marker limits the observation time. In addition, the lateral resolution of labeling method is also limited by the diffraction limit and cannot achieve nanoscale resolution. Although specially designed fluorescent microscopes, such as structured-light illuminated microscopy,2 can achieve nanoscale spatial resolution, its axial resolution is still limited.
Sign up for Advanced Photonics Nexus TOC. Get the latest issue of Advanced Photonics Nexus delivered right to you!Sign up now
1.1.3 Vibrational Spectroscopy
Vibration spectroscopy, including infrared spectroscopy and Raman spectroscopy, probes the specific molecular vibrations and rotations. It has the advantage of high sensitivity to the change of molecular conformation and low damage to biomedical samples. Mid-infrared and far-infrared terahertz (THz) are the most commonly used spectral ranges in infrared vibrational spectroscopy. The mid-infrared wave is an electromagnetic radiation with a wavelength range from 2.5 to , which corresponds to the fundamental frequency absorption band of most organic substances, and can differentiate biomedical samples by identifying specific functional groups. The THz wave, spanning wavelengths from 30 to , corresponds to the rotational and vibrational energy level transitions of molecules, and can be applied to chemical identification and characterization of many substances. However, the resolution of these methods is also limited by the light diffraction, which only reach the micrometer level. In addition, different molecules may have the same bonds, and so it is difficult to distinguish them. Therefore, these methods are difficult to analyze more microscopic and complex biomedical samples.
1.2 Methods with Lateral Resolution at the Nanometer Level
To explore finer biological structures and more microscopic biological functions, such as obtaining the structure of viral and cell membrane proteins, studying how proteins perform their functions, and searching for gene mutation sites, new techniques are needed to overcome diffraction limits. In addition, because of the insufficient resolution of conventional techniques, only the averaged signal of samples is obtained, and it is hard to interrogate single protein or cell. These key limitations emphasize the urgent need to develop new methods for nanoscale detection.
1.2.1 Electron microscopy
Advanced methods based on cryoelectron microscopy, such as single particle analysis and microcrystal electron diffraction, have made important contributions in the study of biological structures. Using these techniques, the atomic-level structure information of biomolecules can be obtained, which is helpful for understanding the structural change and regulation mechanism of macromolecules.
1.2.2 Scanning probe microscopy
Scanning probe microscopy (SPM), including atomic force microscopy (AFM), is a general term for a series of microscopies developed on the basis of scanning tunneling microscopy, with nanoscale resolution. AFM is most commonly performed in biological detection due to its abilities of analyzing the morphological and mechanical properties of biomolecules, such as detecting the surface stiffness of cancer cells3 and observing protein folding.4 In addition, specific recognition can be achieved by chemical modification of AFM probes. However, not every type of biomedical substance can find the suitable corresponding reactant. So the application scope of this specific detection is limited.
The combination of SPM and vibrational spectroscopy, namely, scanning near-field optical microscopy (SNOM), can realize specific biological detection with a wider range of adaptability while maintaining nanoscale spatial resolution. The common vibrational spectroscopies include Raman spectroscopy and infrared spectroscopy. The development of tip-enhanced Raman spectroscopy, which combines AFM with Raman spectroscopy, is hindered by the low spontaneous Raman scattering cross sections of biomolecules. The techniques combining AFM and infrared spectroscopy, namely, infrared near-field techniques, can be roughly divided into two categories according to the different detection signals: one based on optical signals and the other based on mechanical signals. The scattering-type SNOM (s-SNOM) belongs to the first category, which detects the signal of the scattered light of organic samples after infrared irradiation. The atomic force microscope-based infrared (AFM-IR) spectroscopy, peak force infrared (PFIR) microscopy, and photo-induced force microscopy (PiFM) belong to the second category. AFM-IR is a mainly photothermal technique with near-field tip enhancement. It detects the probe oscillation signal caused by thermal expansion of biomedical samples due to infrared light absorption. PFIR is an AFM-IR method. It operates in peak force tapping mode, while the traditional AFM-IR operates in contact mode. The change of AFM working mode reduces the lateral destruction to the sample by the tip, making it more suitable for rough and sticky surfaces. In contrast, PiFM works in tapping mode and detects the change of near-field electromagnetic force. Since these methods use the tips of AFM as near-field probes, the spatial resolution obtained is comparable to the size of the tip, usually in the tens of nanometers. Noteworthy, the PFIR has a higher resolution because the contact area between the tip and the sample is smaller than the radius of the tip in tapping mode. These infrared near-field techniques all have the capacity of nondestructive recognition without labels.
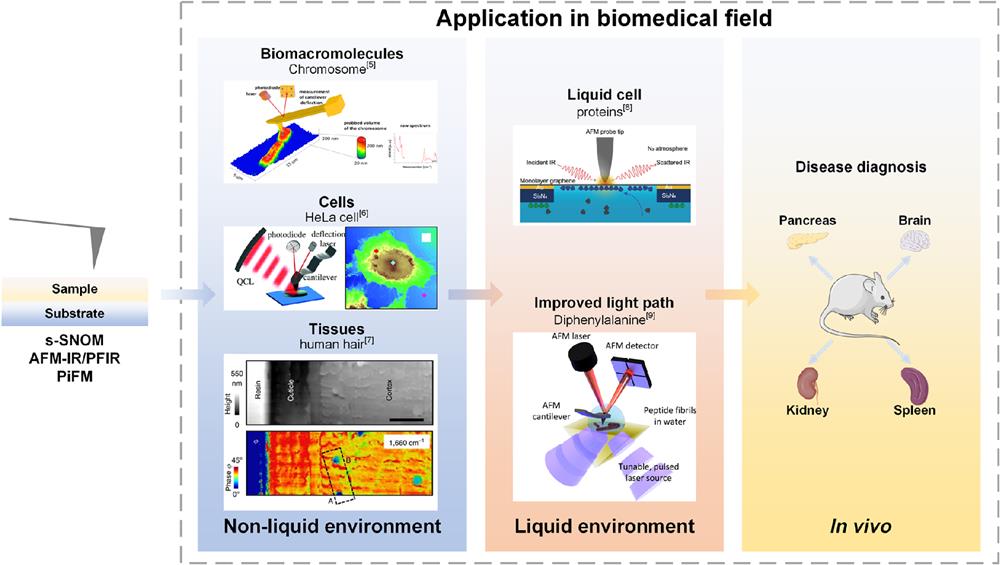
The full-text logical framework is shown in Fig. 1. This review starts with the complexity of the environment, in which biomedical samples are located (from simple to complex including dry environment, liquid environment, and orthotopic environment) and the microscopic biomolecules with different characteristics (including biomacromolecules, cells, and tissues) are dicussed separately. The technical characteristics, unique advantages, and limitations of several near-field techniques (including s-SNOM, AFM-IR, PFIR microscopy, and PiFM) in biomedical detection of microscopic biomolecules are described in detail. Finally, their challenges and potential possibilities in biomedical detection are discussed. This review will pave the way for future studies into microscopic biological characteristics.
![]()
Figure 1.The framework of this review. This review focuses on the recent biomedical research progress of several near-field techniques (including s-SNOM, AFM-IR, PFIR, and PiFM) from the perspective of different environments (including nonliquid environments and liquid environments) and different biological samples. The possibility of
2 Infrared Near-Field Study of Biomedical Samples
2.1 Biomacromolecules and their Complexes
For living organisms, nucleic acid and protein are two basic biomacromolecules for their life activities. By identifying genetic information and studying protein expression and regulation, the functions of proteins in various physiological processes, including metabolism and signal transmission, can be explored, the mechanisms of disease will be elucidated, and the biomarkers for disease diagnosis can be discovered. These processes have a great significance for disease prevention and treatment. In the literature, the width of double-stranded DNA is about 2 nm,10 and the diameter of protein is about 1 to 100 nm.11 Their nanometer physical size determines the need for high-resolution detection methods. Infrared near-field detection not only provides nanoscale resolution, but also can recognize substances according to the infrared absorption peak corresponding to specific chemical bonds, so it is suitable for studying biomacromolecules, such as nucleic acids and proteins. In addition, biomacromolecules can interact with each other to form complexes to achieve more physiological functions, such as proteins interacting with lipids to form biological membranes, and nucleic acids interacting with proteins to form chromatin of eukaryote. Therefore, the discussions about chromatin and biological membranes are also addressed under this classification.
2.1.1 Treatment methods for biomacromolecules samples
When the analyte is a biomacromolecule, such as protein, it is important to purify the sample to minimize the interference of other components to the detection results. High-purity samples can be obtained by conventional protein purification methods. A sample with higher surface flatness will be prepared by spin-coating the liquid containing purified protein onto the substrate. High flatness of samples makes infrared near-field spectra and images have a better quality. When the analyte is a macromolecular complex, such as cell membrane and chromatin, it is necessary to enrich the analyte as much as possible by centrifugation. Casting, rather than spin-coating, is more often applied to these samples. One possible reason is that the size of such samples is larger than that of proteins, which is easier to be observed, so the use of low-concentration solution casting can avoid overlapping between samples.
2.1.2 Test results and analysis
The basic composition of protein is amino acid. The peptide chains synthesized by the dehydration reaction of amino acids are spatially folded, and the proteins with specific functions are formed. The diversity of peptide chain spatial structure makes proteins have wide and various functions. It is worth noting that the secondary structure of the protein describes the spatial orientation of the main body of the peptide chain and can reflect the main structure of the protein. Therefore, the purpose of studying protein function can be achieved by studying the related changes of protein secondary structure. Infrared vibration spectroscopy is often used to nondestructively characterize the secondary structure of peptides and proteins.12 Similarly, in infrared near-field detection, proteins are often studied from three aspects: the classes of secondary structure of proteins, factors causing secondary structure changes, and morphological changes caused by changes in secondary structure. Compared with the conventional infrared vibration method, infrared near-field detection techniques can detect proteins in the nanoscale range due to the use of a nanoscale tip, that is, it can realize the signal detection of individual proteins, rather than the average signal detection of a large area of proteins. For the complexes, such as cell membrane, the properties of the membrane are often speculated by analyzing the secondary structure of the proteins on the membrane. For chromatin, infrared near-field detection can obtain the characteristic signal of methylated groups on chromatin, so as to identify the local methylation of chromatin. This is not possible with conventional infrared vibrational spectroscopy methods.
Classes of secondary structure of proteins
First, the studies about secondary structure of protein are introduced. The secondary structure of protein can be obtained by infrared near-field detection techniques. Proteins with clear secondary structure, such as ferritin complex, lysozyme, -globulin, and catalase, are often selected as the research objects to verify the reliability of near-field systems for detecting proteins. Amenabar et al.13 proved that s-SNOM could identify the secondary structures of the individual protein complexes. Mueller et al.14 obtained the spectrum of lysozyme through AFM-IR. Bechtel et al.15 combined synchrotron infrared radiation with s-SNOM and obtained the subzeptomole sensitivity spectra of -gobulin. O’Callahan et al.16 used s-SNOM to study catalase (a protein widely existing in organisms) and obtained its spectra of secondary structure at nanoscale. Their results showed that there were mixed responses of multiple vibration bands. It should be noted that during the experiment, the drying process of drop cast may lead to crystal disorder and disordered structure. The infrared near-field techniques can not only be used to recognize individual protein molecules but also be used to distinguish different proteins. Fused in sarcoma (FUS), an RNA binding protein that is helpful for phase separation, has also attracted attention because its methylation degree affects the process of phase separation. Qamar et al.17 conducted an AFM morphology test and an infrared spectral test on three kinds of FUS by AFM-IR and qualitatively analyzed their secondary structures during phase separation. In the second derivative spectra, as shown in Fig. 2(a), compared with asymmetric demethylated-FUS, hypomethylated-FUS has a higher content of antiparallel -sheet, random coil and -turn, a lower content of -helical and -sheet, and a lower degree of methylation. Compared with the first two FUSs, the specially prepared FUS + 16R had lower content of antiparallel -sheet and higher content of parallel -sheet. This meant that the secondary structure and methylation of FUS protein could be characterized. Ji et al.21 used PiFM to characterize the single protein particles of three biotoxin with molecular weights as low as 30 kDa and established a database model based on their photoinduced force spectra. Waeytens et al.22 proposed a method to predict the secondary structure of protein from AFM-IR spectra. Kallas et al.23 studied the protein coverage of biomaterials in different bodily fluids by PiFM. Not only natural proteins but also synthetic proteins have been analyzed. Rosu et al.24 characterized composite particles containing hydrophobic polypeptides and explored the protein distribution based on the PiFM measurements. Cristie-David et al.18 used PiFM to acquire the chemical composition of the self-assembling protein cage, as shown in Fig. 2(b). The obtained infrared spectra showed amide I band and amide II band, which represented the characteristics of protein, indicating that the obtained particles were indeed composed of proteins. Abrego-Martinez et al.25 proved the uniform distribution of S-proteins on aptamer-based biosensors by PiFM.
![]()
Figure 2.The application of near-field detection of biological macromolecular samples. (a) The average IR spectra and the second derivative spectra obtained from three kinds of FUS. Adapted with permission from Ref.
The secondary structures of proteins fibrils at different aggregation stages have also been studied. Ruggeri et al.26 observed the formation process of amyloid fibrils with AFM-IR and proved that their nanomechanical properties were related to their secondary structure, especially the content of -sheet. Adamcik et al.27 revealed the chemical structure transition from amyloid fibrils to amyloid microcrystals using AFM-IR. Their results showed that from fibrils to microcrystals, the content of protein secondary structure -sheet increased, and the content of random coil decreased. Banerjee et al.28 proved for the first time that the structure of early stage amyloid aggregates was heterogeneous.28 Wang et al.29 identified FapC fibrils with different formation stages from PFIR results. Banerjee et al.30 found that tau fibrils with different aggregation times had similar morphology but had significant differences in secondary structure. In the early stage of fibrils, there were more parallel -sheet structures, while in mature fibrils, there were more antiparallel -sheet structures. Factors affecting fibril aggregation have also been investigated. Henry et al.31 detected the interaction between and different lipid membrane models by AFM-IR and explored the effect of cholesterol on the formation of amyloid fibrils. Since the formation of amyloid plaques was related to the electrostatic interactions between amyloid fibers, and the electrical characteristics of biological samples could be obtained through Kelvin probe force microscopy (KPFM), Jakob et al.32 revealed the correlations between residual charges and secondary conformation in amyloid fibers by PFIR-KPFM. Their results showed that there were more positive charges in the regions that were rich in -sheets and random coil structures.
To further improve the detection sensitivity, nanostructures can be used. O’Callahan et al.33 used gold nanorods as half-wavelength antennas in 2019 and combined with s-SNOM to realize nanoimaging of horse ferritin. The secondary structure of ferritin is mainly -helical. After using gold nanorods, there was plasma resonance near , which was consistent with the resonance frequency of the secondary structure of protein. Compared with the detection limit of protein obtained by conventional surface-enhanced infrared absorption (SEIRA) detection using gold nanorods, SEIRA combined with s-SNOM could detect at least seven protein complexes, that was, the total protein quality of and enhanced sensitivity times.34 In addition, the normalized signal-to-noise ratio obtained by this method was . Without gold nanorods, the normalized signal-to-noise ratio was . Because the nanoantenna could enhance the resonance signal, the sensitivity was an order of magnitude higher than that of the simple s-SNOM. An optimized system can also be employed to enhance signal sensitivity. When using AFM-IR to study the structure of amyloid fibrils, Waeytens et al.35 suggested equipping a bottom-up lighting system with s-polarization and silicon tip. Ruggeri et al.19 obtained the secondary structure information of single thyroglobulin protein and apoferritin protein using off-resonance AFM-IR, as shown in Fig. 2(c), with high sensitivity and signal-to-noise ratio ( to 20). These applications illustrate the ability of using infrared near-field techniques to recognize the secondary structure of proteins. This will offer new approaches for identifying proteins with no significant morphological differences but different secondary structures.
Factors causing secondary structure changes
The secondary structure of proteins may change when affected by external factors, including nanomaterials,36 radiation,37,38 and chemicals.39
Morphological changes caused by changes in secondary structure
In addition to the first two aspects, the change of overall morphology caused by the change in protein secondary structure has also attracted the attention of researchers. Take silk protein, with special physical properties, as an example. Silk protein mainly has a layered -sheet structure. Qin et al.44 observed the structure changes of silk protein after electron beam irradiation by s-SNOM and AFM-IR. The spatial resolution of the system was equivalent to the size of silk protein, about 10 nm. The middle areas of the spin-coated silk protein sample were hollowed out to expose the silicon at the bottom, which were served as the control. When electron beam irradiation was not used, the s-SNOM images contrast at (corresponding to -sheet) was better than that at (corresponding to random coils). It was generally believed that the higher contrast between the sample and the substrate there was, the more material components it contained. Therefore, silk protein contained more -sheet and fewer random coils. When using electron beam irradiation, with the increase of electron beam dose, the contrast difference between 1631 and gradually decreased, which meant that the -sheet structure of silk protein changed and gradually turned into random coils. When the electron beam dose reached a certain amount, the contrast at was greater than that at , which was due to the decrease of -sheet structure and the increase of random coils structure. When the electron beam dose continued to increase, silk protein would recrystallize and change from random coils to -sheet. When the electron beam dose increased , silk protein no longer had a large number of -sheet structures due to carbonization. In addition, they also quantitatively analyzed the composition changes under different doses of electron beam irradiation with AFM-IR. Each absorption peak of AFM-IR corresponded to the specific molecular resonance of protein and provided a unique chemical fingerprint at the nanolevel. Based on these works, they proposed a new method: by controlling the protein thickness and electron beam dose, nanopatterns not limited by diffraction limit but limited by electron diffraction () were prepared. Due to the low efficiency of electron beam lithography, there was still much room for improvement. Based on the characteristics of conformational transformation of silk protein due to radiation, Lee et al.45 used tip-enhanced near-field infrared nanolithography to induce controlled deformation of silk protein. They obtained a “silk drive” which had storage density. By changing the incident light frequency and power of s-SNOM, the near-field signal diagrams under different conditions could be obtained, and the optimal conditions could be selected by the morphology of the characteristic size on the signal diagram. For better outcome results, they also used gold-plated needle tips and gold substrates. In addition to using thermal radiation to generate features, the purpose of erasing features could also be achieved by increasing laser power. In addition, the stability of the sample was tested to prove its biocompatibility. The near-field optical techniques can be used to control the morphology of silk protein at nanometer level and fabricate biocompatible devices, which provide new opportunities for the development of implantable biointegrated electronics.
Based on the mature application of mid-infrared in biological detection, most near-field biological detection techniques are equipped with mid-infrared light sources. With the development of far-infrared THz technology, near-field biological imaging using THz waves has also emerged. Yang et al.46 observed IgG molecules with THz near-field optical microscopy and realized THz near-field imaging of a single molecule. They used highly oriented pyrolytic graphite, a material with high reflectivity to THz, to make the biomolecules on it have a high contrast. At the same time, they used optimized platinum tip to enhance the signal to realize THz imaging of single IgG biomolecules. By comparing the IgG morphology obtained from this system with that from previous experiments, the corresponding position of IgG molecules was found, and the near-field imaging of the region was obtained. Although the THz scattering signal of biomolecules is weak, and it is impossible to obtain the spectra with biomolecular characteristics as in the mid-infrared, the THz near-field microscopy is still an important supplement to the infrared near-field detection.
Cell membrane
Next is the content related to biological macromolecular complexes, starting with the cell membrane. Considering the complexity of a real cell membrane, simplified cell membrane models are used. Cernescu et al.47 utilized s-SNOM to detect the simplified models of membranes, the single phospholipid bilayers, and obtain their nanospectra. Lipiec et al.48 identified the composition distribution in the simplified artificial membranes models by AFM-IR. Siddiquee et al.49 used s-SNOM to recognize cholesterol-induced phase-separated domains in the dimyristoylphosphatidylcholine (DMPC) membrane and found that cholesterol molecules bound to the DMPC membrane by hydrogen bonding of the alcohol. The absence of organelles, such as nucleus, makes erythrocyte membrane become an appropriate model for studying membrane function. The components of erythrocyte membrane mainly include proteins and lipids, in which proteins mainly are blood shadow protein and actin, and lipids mainly are phospholipids and cholesterol. The function of cell membrane protein is to form the cell membrane skeleton, and its structure is mainly composed of -structure, including -parallel and -sheet. It should be noted that if no additional means are taken and only a salt solution is used to rupture the red blood cells, the obtained cell membrane will contain part of hemoglobin. The secondary structure of hemoglobin is mainly -helical. The erythrocyte membrane of atherosclerotic mice was analyzed by Blat et al.50 Compared with the results of traditional FTIR, ATR-FTIR, and Raman spectroscopy, only s-SNOM could characterize the changes of the secondary structure of proteins on the intact erythrocyte membrane.50 Due to the different secondary structures of different proteins and lipids in the whole model, various components could be distinguished by analyzing the peak positions corresponding to the secondary structure. The spectra showed that the high-intensity vibration peaks at 1650 and corresponded to -helical (hemoglobin), while the small peaks at 1676 and corresponded to -structure (blood shadow protein and actin). According to the second derivative spectrum, the corresponding spectral intensity of diseased mice was higher than that of normal mice at , and there was a shift of the 1620 to . These two changes corresponded to the changes of cell membrane skeleton, which might due to the changes of erythrocyte membrane structure in diseased mice. In addition, the ratio of the peak intensity of the -helical in the amide I region to that of in the amide II region increased, which meant that the hemoglobin of diseased mice changed. Bacteriorhodopsin, a small molecular weight membrane protein on the cell membrane of Halobacillus Archaea, has the function of transferring protons from the inside of the cell membrane to the outside by absorbing light energy, and is often selected as a model to study receptor protein and transmembrane transporter. Giliberti et al.51 applied AFM-IR to identify the hydration state of rhodopsin within 50 nm on the cell membrane and successfully detected the fully hydrated protein in the randomly distributed hydration state. Compared with the traditional infrared detection techniques, the nanoheterogeneity of cell membranes could be observed. Giliberti et al.52 also studied the photoinduced conformational changes of a single bacterial rhodopsin mutant with AFM-IR. Photosensitive proteins absorbed different visible light and had different conformational changes. The gold-coating tip and gold substrate were used to enhance the plasma field and enhanced the signal-to-noise ratio. They proved that AFM-IR combined with a tip-enhanced plasma field could recognize the subtle conformational changes of nanosample transmembrane protein, and the number of detected proteins was about 500. Their results showed that the proteins on the membrane either followed the standard proton pump photoperiod or were in the intermediate state without causing light-induced proton transport. The above examples show that infrared near-field techniques will give an insight into the conformational changes of heterogeneous proteins in their native membrane environment.
Chromatin
In addition to cell membranes, chromatin containing genetic information has also been studied. As a benchmark for the characterization of protein-DNA complexes, Custovic et al.53 deposited DNA onto the prepared mica surface and observed the nanospectra of DNA using AFM-IR. Lipiec et al.5 studied human methylated chromatin with AFM-IR. Heterochromatin is different from euchromatin because of methylated cytosine. It is difficult to measure the spatial distribution of euchromatin and heterochromatin on chromosomes using a traditional optical microscope. There are two possible reasons: (a) the size of chromosome is between 2 and , and the resolution of microscope is insufficient. (b) The chromatin in metaphase is closely arranged, and the situation observed at different times is different. AFM-IR can not only obtain chemical information but also do less harm to the structure of chromatin. So it is suitable for studying the methylation of chromatin. AFM-IR signals obtained from methylated DNA, unmethylated DNA, chromosomes with low methylation degree, and chromosomes with high methylation degree were compared: In the frequency band related to methylene and methyl, methylated DNA and chromatin had spectral changes, but unmethylated DNA did not show spectral changes. Figure 2(d) shows the ratio image between two integrated absorption bands of AFM-IR and the result of immunostaining. There is a good consistency between them. In the AFM-IR result, there are more methylated sites in the yellow region and fewer in the green region. In addition, nuclei, containing a lot of genetic information, are also explored. Ajaezi et al.54 employed s-SNOM to identify the components in lymphocyte nuclei, acquired the characteristic absorption spectra of protein and nucleic acid, and obtained their spatial distribution in the nucleus. It is possible to visualize the distribution of protein and DNA in the nucleus or chromosome using infrared near-field techniques.
Virus
Since virus contains both proteins and nucleic acids at the same time, this section introduces the relevant research of virus. The structure of the virus can be identified and the chemical composition of proteins on the virus can be obtained by near-field detection techniques. As shown in Fig. 2(e), Gamage et al.20 yielded the spatial structure information of a single virus through s-SNOM and realized the recognition of its surface glycoprotein, hemagglutinin. Dou et al.55 imaged the external component proteins and internal component nucleic acids of HSV-1 and MS2 viruses by AFM-IR. According the results of the imaging map, for virus HSV-1, the protein distribution on its outer surface was uneven, and the internal nucleic acid components were more evenly distributed, while for virus MS2, it was just the opposite. This conclusion was also confirmed by cryo-EM results. Mester et al.56 studied tobacco-mosaic-virus and characterized it by the s-SNOM infrared characteristic signal of the protein on the virus. Their results revealed artifacts in the obtained nanospectra due to the presence of large structures near an individual virus. In order to avoid near-field artifacts, the spectral characterization could be improved by calculating the ratio of infrared near-field data.
Infrared near-field detection has the characteristics of nanoscale precision, single-molecule sensitivity, and nonadditional labeling. It can recognize the spectral characteristics of biological systems, identify and analyze the conformation of a single protein, and characterize heterogeneous molecules. It can also be used to study the denaturation mechanism of protein under the interference of external conditions and make use of its reversible conformation change characteristics to prepare a biological storage medium or a biomimetic microenvironment for new biomedical applications. Considering the importance of methylation of genetic material in cancer development, infrared near-field detection techniques with the ability to identify methylation sites will play an important role in cancer screening. In addition, the use of infrared near-field detection can achieve label-free identification of viruses, which is conducive to preventing the large-scale spread of viruses.
2.2 Cell
The above discussion introduces the relevant research progress of biomacromolecules, such as proteins from the perspective of biomolecules, and reveals their structure and function from the molecular level. Next, let us turn our attention to the field of cell biology. Different from molecular biology, the research object of cell biology is the entire cell. Here we discuss the situation when the detected biological sample is a single cell. In particular, the study of unicellular organisms, like bacteria or fungi, is also divided into this category.
2.2.1 Treatment methods for cell samples
In general, the physical size of cells is much larger than that of proteins, for example, the diameter of human red blood cell is about , whereas the diameter of IgG protein is 10 nm. The cells embedded with embedding medium such as resin can retain their microstructure. The embedded samples are often sliced for ensuring the surface flatness, so that the morphology, structure, and composition of each organelle can be detected more accurately. In addition to the resin embedding method, the method of directly drying cells is also often used. Considering that cells contain a large amount of free water, the loss of free water during the drying process will lead to significant changes in the morphology of the cells, resulting in a different distribution of organelles inside the cells from that before drying. Test results obtained for these samples are more suitable for analyzing whether proteins or lipids are produced in cells, and how they are distributed, rather than for analyzing the function of a specific organelle.
2.2.2 Test results and analysis
The infrared absorption peaks of lipid, nucleic acids, and proteins, which most cell samples contain, can be obtained by infrared near-field techniques. The components information of a cell can be identified by analyzing the nanospectra obtained at the specific location of the cells. The exogenous compound in the nucleus was detected for the first time in 2011.57 And the spatial distribution of various substances can be characterized according to the nanoabsorption maps at specific infrared frequencies. Freitas et al.58 studied the nanoscale structure of proteins on the surface of single primary neurons, as shown in Fig. 3(a), and demonstrated the feasibility of s-SNOM for studying amyloid structures on cell surfaces. The composition and distribution of proteins in the cells will change when cells are exposed to external stimuli, including the use of inducers or nanomaterials, exposing them to oxidative stress conditions and parasitic infections. These differences can be detected by infrared near-field detection. For example, macrophages would exhibit different polarization properties and had different protein conformations under the action of two inducers;62 nanomaterials such as nanodiamond could induce the secondary structure of protein in hepatoma to change from -helical to -sheet or -turn;36 after oxidative stress, the probability of protein aggregation size was 35% higher than that in HeLa cells;6 and red blood cells infected with Plasmodium falciparum exhibited aggregation of hemozoin.63 In addition to directly analyzing the near-field images, the near-field spectral data can also be used to reconstruct the refractive index of cell for disease detection. Tranca et al.64 gained the complex refractive index of a single red blood cell by s-SNOM data. Microvesicles secreted by cells have also been studied. Kim et al.65 used resonance enhanced AFM-IR to analyze the heterogeneity of a single extracellular vesicle and between the same population of extracellular vesicles. Xue et al.66 detected the secondary structures of proteins in disease-related small extracellular vesicles by s-SNOM in 2022. They explored the relationship between protein secondary structure changes and tumor malignancy and successfully distinguished two small extracellular vesicles from different stages of disease development. When stimulated by external factors, the microbubbles secreted by cells are also different. For example, after oxidative stress, there was heterogeneity between the vesicles from two types of mesenchymal stem cells, which had different resistance to oxidative stress.67 At the same time, there was distribution heterogeneity of components such as proteins, nucleic acids, and lipids, between different positions of a single vesicle and between different vesicles of the same type, according to the analysis of infrared near-field images and nanospectra.
![]()
Figure 3.The application of near-field detection of cell samples. (a) AFM-IR maps of single primary neurons. Adapted with permission from Ref.
In addition to cells, bacteria or fungi, which have cellular structures, are often mentioned, and these studies focus on proteins within bacteria. Dazzi et al.68,69 obtained the absorption spectra of proteins and DNA of Escherichia coli (E. coli) and realized the localization of phages inside E. coli, proving the possibility of AFM-IR in single cell detection. Similarly, Meszaros et al.59 used s-SNOM to detect transgenic E. coli and test whether the protein of interest was produced. As shown in Fig. 3(b), E. coli has an absorption signal in the amide I region (). In order to verify that E. coli only produced the desired protein internally, nanoabsorption spectra were collected at both its internal and external positions. The results are shown in Fig. 3(c). The spectrum inside the E. coli shows the absorption peak of the protein, whereas the spectrum outside the E. coli does not show an absorption peak, which indicates that the proteins exist only inside E. coli. Otzen et al.70 identified amyloid in E. coli, Pseudomonas, and Archaea Methanosaeta in situ by the AFM-IR absorption peaks corresponding to the -sheet structure of amyloid. To provide further insight into the spatial distribution of proteins or lipid, relevant works have been carried out. The distribution of silaffin protein and silica in genetically modified E. coli was detected by PiFM.71 Kanevche et al.60 performed layer-by-layer analysis of sliced Chlamydomonas reinhardtii and E. coli by s-SNOM. For the phase images of the same slice of Chlamydomonas reinhardtii at different frequencies, the nucleolus and thylakoid could be clearly distinguished, and the cell wall could be obvious displayed. The spatial distribution of proteins in cells could be obtained by reconstructing the s-SNOM images layer by layer, as shown in Figs. 3(d) and 3(e). Deniset-Besseau et al.72 realized the localization of lipid inclusions inside bacteria by AFM-IR. Research related to vesicles in bacteria has also been conducted. Vitry et al.73 used AFM-IR to detect vesicles inside Streptomyces bacteria. As a reliable source of biofuel, Streptomyces can store excess carbon in triacylglycerols, so a reliable method is needed to detect the density of triglycerides in Streptomyces. The approximate location of triglycerides could be determined from the nanoabsorption map of AFM-IR. They preliminarily determined the location of the vesicles using the specific infrared absorption of triglycerides at . However, since the optical absorption signal was also related to the height of the vesicles, the signal generated by the vesicles located just below the cell membrane would be blurred. Therefore, they also used mode synthesizing AFM and combined with the detection results of the two methods for judging the size, position, volume, and other parameters of the vesicles. In addition, Mayet et al.74,75 characterized the distribution of polyhydroxybutyrate (PHB) in a single bacterium Rhodobacter capsulatus by AFM-IR. Rebois et al.76 demonstrated that the PHB in the Rhodobacter sphaeroides vesicles could be detected using AFM-IR, and the crystallinity of PHB could be estimated by deconvolution of the spectrum. The cell walls of fungi were also studied. Bakir et al.77 identified the nanoscale structure and chemical components of the cell wall of the gene deletion strains by s-SNOM. Li et al.61 used PFIR with a resolution of 6 nm to reveal the chemical composition and distribution of yeast cell wall particles. Figure 3(f) shows the high-resolution PFIR images at 1030 and . They observed that there were more -glucans on the cell wall and more chitin at the edges of the bud scars.
The specific infrared absorption peaks of proteins, DNA, and lipids inside the cell can be obtained by infrared near-field detection. The obtained nanochemical maps can be used to characterize the distribution of various components inside the cells, including protein aggregation. Therefore, infrared near-field techniques can directly detect the components of cells, analyze the biochemical behavior inside cells, and evaluate whether individual cells are abnormal. Similarly, infrared near-field detection of vesicles used for cell-to-cell communication can obtain information about their internal components and be applied to early diagnosis of diseases.
2.3 Tissue
Tissues are composed of cells with similar morphology and function. In pathology, biopsy tissues are often observed with a microscope, and the morphological features of the cells are used to grade cancer. In infrared near-field detection, the distribution of specific substances in tissues can be characterized by their infrared characteristic peaks. It has a nanoscale spatial resolution compared with pathological detection methods that enable more precise localization and provide more accurate component information related to lesions. At the same time, because it can acquire the spectral information inside cells and trace the change process of the internal components of cells, it can describe the course of cancer development of the diseased tissue through the change of the main components of the cell in different regions and obtain the key details of the relevant disease mechanism. Because tissue involves a larger number of cells, more attention is paid to the difference between the same type of cells and the intercellular substance or the overall differences between different types of cells, rather than the individual difference between cells of the same type. In addition, new data processing and analysis methods are needed for better analyzing.
2.3.1 Treatment methods for tissue
In general, biology and pathology use sections to study tissue sample. Similarly, when performing infrared near-field detection, cryosection is the most common sample processing method. In addition to cryosection, electron microscopy sample preparation methods, such as epoxy-resin-embedded sectioning, are also commonly adopted. The purposes of slicing include: (a) maintaining the original tissue state as much as possible and making the distribution information of different components more intuitively, and (b) providing the nanoscale surface flatness and minimizing the detection error caused by height.
2.3.2 Test results and analysis
Through the detection of tissue samples, it is possible to identify specific components in the tissue, study the changes in the internal components of the tissue, and distinguish different types of cells. In pathological examinations, sections are often stained to identify a specific substance from a tissue sample. In infrared near-field detection, the composition can be characterized by identifying the infrared characteristic signals of specific substances. At the same time, it can also provide the distribution of specific substances in space at the nanoscale and realize the qualitative analysis and spatial positioning of substances. Johnson et al.78 used rotating frame s-SNOM to detect ultrathin proteins in oyster shells in 2019. The oyster shells are composed of crystals and contain a small amount of protein distributed in bulk. Figure 4(a) shows the s-SNOM phase images of rotating frame in the prismatic region containing the organic sheath, which are used to reconstruct the maps of protein content. Because the content of organic components in the shell was , the signal acquisition time of s-SNOM based on rotating frame was 60 times faster than that of traditional s-SNOM. It is worth noting that the near-field phase diagram of the rotating frame s-SNOM has a blueshift of compared with the traditional s-SNOM, as shown in Fig. 4(b). So spectral accuracy still needs to be improved. Related research based on melanin and lipid in hair has been proposed. Amenabar et al.7 studied human hair with s-SNOM, realizing the labeling of melanin molecules with a spatial resolution of 30 nm. From the cross section of human hair, the hair is composed of epidermal layer, cortical layer, and medulla from outside to inside. The epidermal layer is about , occupying most of the hair space. The secondary structures of keratins in the cortical layer are mainly -helical. There is also melanin in the cortical layer. Melanin can determine the color of human hair. Through the analysis of the near-field image, it was observed that there were disk-shaped areas about 300 nm with lower infrared absorption, which could correspond to the electron microscope results of melanin particles. However, further spectral analysis found that the spectra obtained in the areas considered to be rich in melanin were different from those in the areas considered to contain melanin. The peaks of 1760 and in the spectrum were used to represent the keratins. There were four peaks in the spectrum obtained in the melanin-enriched region, which were 1290, 1454, 1563, and , respectively. However, a spectrogram of some areas that identified as melanin in morphology was quite different from that obtained from the area with rich melanin. Their spectra were more like the spectrograms of keratins, although the peak position could not completely correspond to the keratins. Since it could not be directly proved that the region similar in morphology must be melanin, unsupervised hierarchical cluster analysis was used to analyze the characteristics of different regions, as shown in Fig. 4(c). The areas enriched in melanin and the areas suspected to be melanin show homogeneity. Further analysis speculated that the spectral response of the suspected melanin region was actually a linear superposition of the spectral response of the melanin region and the spectral response of the keratin region. Stanic et al.79 characterized the chemical composition of keratin and melanosome in hair and to distinguish eumelanin and pheomelanin based on their s-SNOM spectral signatures. As shown in Fig. 4(d), the spectra of pheomelanin and eumelanin are significantly different. Bildstein et al.81 used resonance-enhanced mode AFM-IR to localize the lipid distribution in hair. The heterogeneity between tissues, including kidney deposits,82 different skin layers,83 osteoid nodules,84 and sorghum stem wax,85 could be revealed using infrared near-field techniques. Esteve et al.82 carried out AFM-IR spectral analysis of abnormal deposits in the kidney and acquired their chemical composition, including pure vancomycin and organic materials with phosphate. Kemel et al.83 obtained chemical components of different skin layers using AFM-IR. Rammal et al.84 used AFM-IR for precise chemical composition analysis of bone-like nodules. They found clear spectral differences between the cell-rich and collagen-rich regions.84 Farber et al.85 used AFM-IR to assess the heterogeneity of internal and external chemical components of sorghum stem wax.
![]()
Figure 4.The application of near-field detection of bio-tissues. (a), (b) The phase images and spectra of organic sheath. Adapted with permission from Ref.
In addition to the identification of single components, the process of tissue state change can also be explored, including the process of the increase of lenses’s opacity,86 tumor development changes,87 bone maturation process,88,89 tooth mineralization,90,91 and plant silicification.80 Paluszkiewicz et al.86 used AFM-IR to discriminate proteins in clear and opaque (cataractous) human lenses. The secondary structure of proteins in the clear lenses was mainly -turn, whereas the secondary structure of proteins in diseased lenses was mainly antiparallel -sheet.86 They also characterized pleomorphic adenomas and their marginal tissue by AFM-IR.87 Pleomorphic adenoma is a common salivary gland tumor. Although there have been related applications of spectroscopic detection, the change process of tumors needs to be intensively investigated. They detected the structure changes in pleomorphic adenomas and found the presence of amyloid fibrils inside the cells. Imbert et al.88 studied the composition and structure of tissues with different maturities in sheep cancellous bone using AFM-IR. They found that the mineral-to-matrix ratio increased in mature bone tissues and observed a nonmineralized layer.88 Ahn et al.89 focused on the change of matrix/mineral ratio in bone tissue with age. They found that the mineral content increased and the matrix/mineral ratio decreased with age.89 The matrix/mineral transition areas with a size range of 100 to 200 nm were also found in the bone tissue.89 To understand the mechanism details of tooth mineralization, Sereda et al.90 characterized the details of demineralization and remineralization of dentin, and Huang et al.91 detected the differences in chemical composition between peritubular and intertubular dentin in human teeth. According to the analysis of the obtained spectrograms and nanoimages, there were more minerals in the peritubular dentin and more organic matter in the intertubular dentin.91 In order to study the process of plant silicification, Zancajo et al.80 observed four plant samples, such as wheat awn by s-SNOM in 2020. Since the silica had an obvious absorption peak at , this absorption peak could be used in the s-SNOM absorption spectra to analyze whether the wheat awn was silicified, as shown in Fig. 4(e).
When multiple substances within the tissue are of interest, special data-processing methods can be taken to distinguish the different substances. Tranca et al.92 studied zebrafish retinal fragments with s-SNOM. The retinal fragments of zebrafish contain a variety of components, and the various components cannot be distinguished by microscopic observation. For such mixed samples, special data-processing methods can be used to make the data more visible. The phasor method was used to sort out the data obtained by s-SNOM, including near-field amplitude and near-field phase, and the phasor diagrams were recoded after color coding93. The results after treatment showed that four regions corresponding to the four components could be well distinguished.
Using infrared near-field techniques, specific substances within tissues can be identified, including their distribution. The characterization of specific substances contributes to the understanding of tissue heterogeneity and physicochemical properties of biological samples. Therefore, it can be better used to study the development process of tumors and biomineralization mechanism of organisms.
2.4 Samples in Liquid Environment
Considering that the liquid represented by water has a strong infrared absorption, the above samples are tested in a dry environment to obtain a better near-field detection effect. However, the drying process will cause the change of protein structure, produce disordered structure, and affect the judgment of results. In addition, since all organisms need water and biomedical samples have a high-water content, the infrared near-field detection based on liquid environment can provide technical support for future in vivo detection. It can also be used to dynamically study the process of biological samples changing over time,94 which will put forward new requirements for the stability and sensitivity of the system. The difficulty of realizing near-field detection in liquid environments is that water has a strong infrared absorption, and the near-field scattering signal will be absorbed by water, thus affecting its detection. And the liquid will hinder the oscillation of AFM cantilever and change the coupling effect between the infrared light and the needle tip.
2.4.1 Treatment methods for samples in liquid environment
In order to achieve effective detection in the liquid environment, three methods are used, namely, designing a special liquid cell, improving the optical path structure, and using a liquid environment with low infrared absorption. The purpose of preparing special liquid cells is to isolate the liquid environment from the probe. The liquid cell cover is selected carefully, and it needs to transmit infrared light and prevent liquid overflow at the same time. Graphene, with its atomic thickness and infrared transparency, is suited for a lid.95,96 However, because graphene may cause a high-pressure state in the internal liquid environment, other types of materials, such as hydrophilic SiN membrane, are also selected.8,94 The optical path is designed as a total internal reflection mode and equipped with solid immersion lens97 to minimize the liquid absorption of infrared light. In addition, the use of liquids with weak infrared absorption such as can distinguish the infrared absorption of the biomedical samples from the infrared absorption of the liquid.9
2.4.2 Test results and analysis
Diphenylalanine (FF) is a short peptide formed by dehydration and condensation of two phenylalanines and is the core recognition module of amyloid protein in Alzheimer’s disease. Studying the structure of this kind of dipeptide can have a deeper understanding of the process related to amyloid protein. Ramer et al.9 used AFM-IR in a liquid environment to detect self-assembled FF aggregates and FF aggregates modified by tertbutoxycarbonyl (Boc-FF) and distinguished the two aggregates through different spectrograms. The morphologies of the two aggregates were similar, so they could not be distinguished directly, as shown in Fig. 5(a). Because the secondary structures of FF and Boc-FF are different, the corresponding infrared spectral response will also be different. As shown in Fig. 5(b), the infrared spectrum of the Boc-FF polymer was different from that of the FF polymer. Due to the existence of additional carboxylic group and tertbutyloxycarbon group, there were absorption peaks at 1730 and in the spectrum of Boc-FF, and molecules had greater conformational freedom and new -helical structures. The absorption peak of antiparallel -sheet related to FF in Boc-FF () overlapped with the absorption peak of a carbamate group in Boc-FF (), which made the peak move to high frequency. In addition to the above polypeptide aggregates, human serum albumin with relatively simple structure has also been used in research. Meireles et al.96 combined with synchrotron radiation accelerator and near-field optics and used a special liquid cell covered with graphene to conduct nanoscale infrared analysis of human serum albumin. Graphene acted as a barrier to water and an optical window. Because human serum albumin would adhere to the graphene layer, there was a liquid-free protein region below the graphene. There were two peaks at 1650 and , which corresponded to amide I and amide II bands. This work achieved a spatial resolution of 25 nm and detected 1120 human serum albumin molecules within a thickness of 50 nm. In addition, the dynamic assembly process of protein at nanometer level can be analyzed. Zhao et al.8 used s-SNOM and a liquid cell closed by graphene membranes to characterize the self-assembly process of S-layer proteins. By providing a variety of buffer conditions, they demonstrated that the self-assembly strength of proteins increased nonlinearly with time, and the assembly was inhomogeneous. Figure 5(c) shows the changes of nanospectra with time in different concentrations of calcium ions. As plotted in Fig. 5(d), the integral intensity of the amide I and II bands increases gradually with time. They proved that the concentration of calcium had an impact on protein assembly.
![]()
Figure 5.The application of near-field detection in liquid environment. (a), (b) AFM-IR results of the FF and Boc-FF in
In addition to proteins, cell structures, such as cell membranes and cell walls, have also been studied. Pfitzner and Heberle97 chose a solid immersion lens as infrared transparent material in 2020 and studied the purple film of bacteria in a liquid environment, as shown in Figs. 5(e)–5(g). They used the silicon hemisphere as a solid immersion lens. Whether in a dry environment or a liquid environment, the signal diagrams under different wavenumbers were obviously different. At , obvious contrast could be seen, but at , there was no obvious contrast, indicating that this method could detect the bacteriorhodopsin, which had the secondary structure of -helical. By improving the illumination light path and detection light path, the imaging quality in liquid was optimized, and the signal-to-noise ratio of the system in water was improved from 3.9 to 11.8. Their work provided a new idea for liquid measurement and also gave a method to optimize the spectral quality. Wang et al.98 used liquid-phase PFIR, with a spatial resolution of 10 nm, to confirm the chemical composition of the budding site of yeast cell wall particles, as shown in Figs. 5(h)–5(j). They proved that there was protein around the budding site. Viruses in liquids have also been studied. Khatib et al.95 took the graphene as a lid and identified the proteins of individual viruses by s-SNOM. The dynamic changes of individual bacteria or cells can also be observed. Mayet et al.99 carried out an AFM-IR test of water-immersed bacteria. Kaltenecker et al.94 used a SiN film as the cell cover to explore E. coli and live cancer cells. The s-SNOM images of cancer cells at different times were recorded, showing how the cancer cells changed over time.
For biomedical samples, such as proteins, cell membranes, and cells, the infrared near-field detection techniques based on liquid environments can achieve nanospectral results and have the nanoscale resolution and the single molecule sensitivity similar to that based on dry environments. Biomedical samples retain some activity in their natural environment, so their dynamic processes can be detected. With the further optimization of infrared near-field detection techniques in liquid environments, it will have great development prospects to study pathological process of related tissues in vivo samples while improving the sensitivity and signal-to-noise ratio of the system.
3 Summary and Outlook
In this paper, we reviewed the applications of s-SNOM, AFM-IR, PFIR, and PiFM in biomedical detection in the last few years according to different sample types. Infrared near-field detection techniques represented by the above-discussed means have excellent spatial resolution and chemical fingerprint features and have been applied in many areas, including biomedical detection. For research in the life sciences, they are powerful tools to detect microstructure changes and microresponse changes in living organisms, and can be used to better understand biological processes. By identifying proteins, nucleic acids, and other components in cells, it is expected to identify the amino acid sequence of proteins or gene methylation. And the change process of the internal components of the tissues and the development process of the disease can be tracked. Various changes in live biomedical samples can be explored for more precise biomedical research. It is worth noting that the interaction mechanism between the probe and the sample needs further investigation. The interaction between them has an impact on the final spectra, resulting in the difference between infrared near-field optical detection and far-field optical detection, which is not conducive to subsequent spectral analysis. In addition, in order to make better use of these near-field optical techniques, the following methods can be used to further improve the system sensitivity, including: (a) using more efficient light sources and sensitive detectors, including synchrotron radiation;79 (b) optimizing the probe structure, such as designing a structured probe to improve the coupling efficiency with the light source;100 (c) using a structured substrate33 or pretreating substrates53 to increase the response between the probe and the biomedical sample; (d) selecting the substrate with higher scattering efficiency and flatness, such as silicon wafer101 or graphene;46 and (e) optimizing detection modes, including using off-resonance infrared nanospectroscopy,19,43 removing tip–sample interaction effects by calculating the sample-dependent cantilever responsivity,102 and using liquid-phase PFIR.98 At the same time, in order to better process and analyze the obtained spectral data, approaches including a second derivative method,70 the compressed sensing method,78,103,104 the phasor method,93 the principal component analysis method,62 and hierarchical clustering7 can be adopted. By optimizing the system, such as developing lock-in amplifier-based PFIR microscopy to reduce the operation cost105 and designing dual-color PFIR microscopy to improve efficiency,106 the relevant application scenarios will be further expanded. Moreover, the near-field detection of biomedical research is mainly in the mid-infrared region, and the detection based on the THz region is still in the exploration stage and has a great potential for development. We believe that in the future, with the help of these near-field detection techniques, more interesting and valuable biomedical phenomena can be discovered.
Xitian Hu is currently working toward her doctoral degree at the University of Shanghai for Science and Technology, Shanghai, China. Her research interests include application of terahertz near-field in biomedicine.
Li Zhou is currently working toward his MS degree at the University of Shanghai for Science and Technology, Shanghai, China. His research interests include application of terahertz near-field in biomedicine.
Xu Wu received her ME and PhD degrees in material science and technology from Zhejiang Sci-Tech University, Hangzhou, China, in 2013 and 2017, respectively. In 2018, she joined the Terahertz Technology Innovation Research Institute, University of Shanghai for Science and Technology, Shanghai, China, as a postdoctoral fellow. Her research interests include terahertz spectroscopic studies of biosolutes in human plasma at the molecular level by the combination of a variety of biophysical techniques.
Yan Peng received her degree from the Department of Physics, East China Normal University, Shanghai, China, in 2009. In 2009, she joined Shanghai Key Laboratory of Modern Optical System, University of Shanghai for Science and Technology, Shanghai, China. In 2013, she joined the Optical Research Center, University of Rochester, New York, United States, as a scientist. In 2014, she joined the University of Pennsylvania as an adjunct professor. Since 2016, she has been a professor at the University of Shanghai for Science and Technology. Her research interests include generation and regulation of terahertz waves and application of terahertz waves in biomedicine.
References
[58] R. O. Freitas et al. Nano-infrared imaging of primary neurons. Cells, 10, 2559(2021).
[104] B. Kaestner et al. Compressed sensing FTIR nano-spectroscopy and nano-imaging. Opt. Express, 26, 18115-18124(2018).
[106] Q. Xie et al. Dual-color peak force infrared microscopy. Anal. Chem., 94, 1425-1431(2022).

Set citation alerts for the article
Please enter your email address
© Copyright 2018-2021 | Chinese Laser Press. All Rights Reserved 沪ICP备15018463号-20