
Yilin He, Jingdi Zhang, Si Xiao, Yingwei Wang, Jun He. Effect of concentration on the formation time of diffraction rings in spatial self-phase modulation[J]. Chinese Optics Letters, 2022, 20(1): 011901
- Chinese Optics Letters
- Vol. 20, Issue 1, 011901 (2022)
Abstract
1. Introduction
It has been 40 years since spatial self-phase modulation (SSPM) was discovered in 1981[
Recently, all-optical switching and information converters based on SSPM have been developed[
The “wind-chime” model is an ideal model proposed by Zhao’s group based on non-local electronic coherence theory, which can be used to calculate the formation time of the diffraction rings from the initial to maximum number of rings. When the light is incident on the sample, the nanosheets begin to be polarized. Initially, there is an arbitrary angle between the nanosheet and the electric field. Thanks to energy relaxation, the electric field reorients the nanosheets so that each domain contains an axis parallel to the polarization direction of the external field, just like a “wind chime”[
Sign up for Chinese Optics Letters TOC. Get the latest issue of Chinese Optics Letters delivered right to you!Sign up now
2. Materials and Methods
The nanosheets were synthesized via conventional liquid phase exfoliation[
![]()
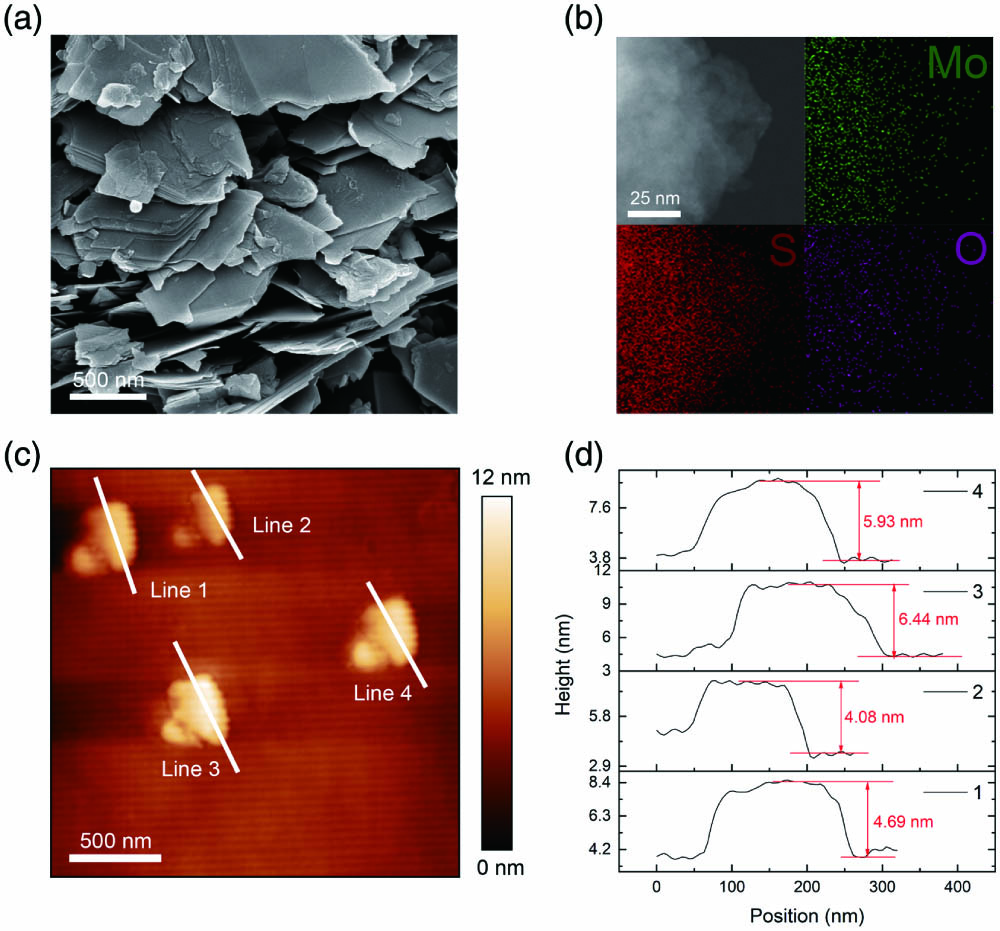
Figure 1.(a) SEM image of MoS2 nanosheets. (b) STEM image and EDX mapping images of MoS2 nanosheets. (c) AFM image of MoS2. (d) The height profiles corresponding to the solid lines in (c).
The experimental setup of SSPM is shown in Fig. 2(a). A femtosecond (fs) laser regenerative amplifier from Spectra-Physics was utilized as the experimental light source. The laser is incident at a wavelength of 700 nm (it can be seen from Ref. [18] that at different wavelengths, the formation time of the diffraction rings is nearly the same) with a repetition frequency of 2 kHz and a pulse width of about 40 fs. Due to the use of the fs laser, the heat generation is very limited during the nonlinear optical response measurement here. The focal length of the lens was 20 cm, and the cuvette size was . While testing , its front surface was 10 cm away from the lens, and the back surface was 22.5 cm from the laser beam profiler (LBP2-VIS2). The camera features a resolution array of , the acquisition mode is 12 bits, and the time resolution is up to 30 frames per second.
![]()
Figure 2.(a) Schematic setup of SSPM. (b1)–(b5) The dynamic process of the diffraction ring patterns. (c1)–(c3) Unsaturated wind-chime model changes with the increase in time.
3. Results and Discussion
When light passed through the sample, diffraction rings began to appear until the radius of the SSPM pattern reached its maximum [Figs. 2(b1)–2(b4)]. Then, the upper part of the diffraction rings collapsed downwards to form a stable conical structure that is vertically asymmetric [Fig. 2(b5)], which is caused by the thermal convection phenomenon[
Furthermore, the reorientation of a 2D material can be explained according to the following process: under laser irradiation, photo-excited electrons and holes move in opposite directions, which polarizes the 2D material. The polarized 2D material would be reoriented parallel to the electric field to minimize the system’s energy. The formation time of diffraction rings in Figs. 2(b1)–2(b4) is equal to the time required for the nanosheets reorientation in Figs. 2(c2)–2(c3). Moreover, the ring formation time can be calculated as follows[
![]()
Figure 3.(a) Number of rings versus different concentrations. (b) The experimental values and two kinds of theoretical values of ring formation time at different concentrations.
In the traditional model[
In fact, in the general “wind-chime” model, the total number of fragments has been determined once the sample solution is determined[
At a fixed concentration, the number of SSPM rings is proportional to the number of fragments , which have already generated electron coherence. The light intensity determines the number of fragments that can generate electron coherence. Still, it is not inversely proportional to , because the change in light intensity changes the number of coherent fragments and the number of SSPM rings simultaneously (at different intensities, producing one ring needs different ). Therefore, we introduced the proportionality coefficient . Finally, it is organized into
Moreover, according to the optical Kerr effect, the nonlinear refractive index can be described as[
In the ideal model, the fragments in the solution are evenly distributed from 0 to . At different concentrations, the average rotational angle of fragments that generated electron coherence should be proportional to the effective amount of fragments . Therefore, the following equation can be obtained:
As can be seen from Fig. 3(a), the number of SSPM rings keeps increasing constantly as the concentration remains relatively small. As the concentration reaches the saturation value at or so, the number of rings no longer increases. In Fig. 3(b), the formation time of diffraction rings decreases with increasing concentration. It is concluded that specific light intensity can make a limited number of fragments produce electronic coherence. When the light intensity is saturated, the SSPM rings can no longer change even if the concentration increases. There are three concentrations corresponding to the number of rings of seven because the concentration has a small effect on the number of rings[
In Fig. 3(b), the black points represent the experimental values, the red dots represent the theoretical values calculated by Eq. (10), and the blue dots represent the theoretical values calculated by Eq. (1). Through experiments, we found that the formation time will decrease as the concentration increases under the same light intensity. Especially at high concentrations (), the theoretical result of the original formula (1.66 s) is about eight times the experimental value (0.21 s).
It is difficult for the original formula to calculate the formation time of the diffraction rings precisely under different concentrations.
Comparing the theoretical and experimental values, it is found that the theoretical value can also show the trend of the change in theoretical data such as and , which indirectly verifies the credibility of the formula presented in this work. The error of the data largely comes from low-concentration samples because there are fewer 2D fragments. When the sample concentration is low, the proportion of thermal effects increases, and the nonlinear optical characteristics are weakened. Since the thermal effect is not considered in this article, there is a difference between the experimental data and the calculated data.
Equation (10) can be used to accurately fit the relationship between the formation time and the sample concentration at the same light intensity. The formation time of the diffraction rings is related to the sample concentration and closely related to the incident light intensity. Using this formula, the experimental values for the different incident light intensities are compared with the theoretical values under the condition that concentration is consistent with the value of in the calculation process. Figure 4 displays the comparison of the theoretically calculated value and experimental value at the concentrations of , , and . At high concentration, the difference between the theoretical and experimental values is within the error range (0–0.14 s). With the decrease of light intensity at low concentration, the gap between the theoretical value and the experimental value becomes larger and larger and is gradually distorted.
![]()
Figure 4.Time varying with light intensity and concentration. The cubic dots represent the experimental values, and the spherical dots represent the theoretical values.
4. Conclusions
Combining all of the above results, we found that the formation time of the diffraction rings gradually decreases with the increase in light intensity and the increase in the concentration. The surface fitted by a small amount of experimental data can predict the formation time of the diffraction rings under specific concentrations and intensities. In other words, it provides a facile way to find the condition of concentration and light intensity corresponding to the shortest formation time. Due to the limitation of our detector’s resolution, we cannot observe a response time less than 0.07 s. There are saturation values for both light intensity and concentration, and hence from Eq. (10), the response time cannot be infinitesimally small. Besides, due to the complexity of the formula, the formation time cannot become infinitely small by only changing the concentration. But, the viscosity coefficient can be infinitely large. In other words, the reorientation of fragments is eliminated by preparing solid films. In this way, the number of rings will not increase over time, and the response time will be significantly reduced. The method we proposed is theoretically feasible, though it can be complicated to get diffraction ring patterns in solid materials.
Using the experimental data of at different concentrations, a new unsaturated wind-chime model was successfully established. By comparison, the calculated data is consistent with the experimental data, verifying the feasibility of the formula at different materials and different concentrations. At the same time, the formula is also applicable for calculating the ring formation time of the 2D layered material at different intensities. Finally, the shortest formation time of diffraction rings can be predicted by limited experimental data. The results obtained herein have advanced significance for photonic devices such as photodiodes.
References
[1] S. D. Durbin, S. M. Arakelian, Y. R. Shen. Laser-induced diffraction rings from a nematic-liquid-crystal film. Opt. Lett., 6, 411(1981).
[2] Y. Wu, Q. Wu, F. Sun, C. Cheng, S. Meng, J. Zhao. Emergence of electron coherence and two-color all-optical switching in MoS2 based on spatial self-phase modulation. Proc. Natl. Acad. Sci. USA, 112, 11800(2015).
[3] S. Xiao, Y. Zhang, Y. Ma, Y. Wang, Y. He, J. Zhang, Y. Jiang, X. Li, R. Yang, J. He, Y. Wang. Observation of spatial self-phase modulation induced via two competing mechanisms. Opt. Lett., 45, 2850(2020).
[4] G. Wang, S. Zhang, F. A. Umran, X. Cheng, N. Dong, D. Coghlan, Y. Cheng, L. Zhang, W. J. Blau, J. Wang. Tunable effective nonlinear refractive index of graphene dispersions during the distortion of spatial self-phase modulation. Appl. Phys. Lett., 104, 141909(2014).
[5] Y. Wang, Y. Tang, P. Cheng, X. Zhou, Z. Zhu, Z. Liu, D. Liu, Z. Wang, J. Bao. Distinguishing thermal lens effect from electronic third-order nonlinear self-phase modulation in liquid suspensions of 2D nanomaterials. Nanoscale, 9, 3547(2017).
[6] S. Xiao, B. Lv, L. Wu, M. Zhu, J. He, S. Tao. Dynamic self-diffraction in MoS2 nanoflake solutions. Opt. Express, 23, 5875(2015).
[7] G. Wang, S. Zhang, X. Zhang, L. Zhang, Y. Cheng, D. Fox, H. Zhang, J. N. Coleman, W. J. Blau, J. Wang. Tunable nonlinear refractive index of two-dimensional MoS2, WS2, and MoSe2 nanosheet dispersions. Photon. Res., 3, A51(2015).
[8] X. Li, K. Hu, B. Lyu, J. Zhang, Y. Wang, P. Wang, S. Xiao, Y. Gao, J. He. Enhanced nonlinear optical response of rectangular MoS2 and MoS2/TiO2 in dispersion and film. J. Phys. Chem. C, 120, 18243(2016).
[9] J. Li, Z. Zhang, J. Yi, L. Miao, J. Huang, J. Zhang, Y. He, B. Huang, C. Zhao, Y. Zou, S. Wen. Broadband spatial self-phase modulation and ultrafast response of MXene Ti3C2Tx (T = O, OH or F). Nanophotonics, 9, 2415(2020).
[10] Y. Wang, Y. Wang, K. Chen, K. Qi, T. Xue, H. Zhang, J. He, S. Xiao. Niobium-carbide Mxenes with broadband nonlinear optic response and ultrafast carrier dynamics. ACS Nano, 14, 10492(2020).
[11] G. Wang, D. Bennett, C. Zhang, C. Ó Coileáin, M. Liang, N. McEvoy, J. J. Wang, J. Wang, K. Wang, V. Nicolosi. Two‐photon absorption in monolayer Mxenes. Adv. Opt. Mater., 8, 1902021(2020).
[12] L. Wu, W. Huang, Y. Wang, J. Zhao, D. Ma, Y. Xiang, J. Li, J. S. Ponraj, S. C. Dhanabalan, H. Zhang. 2D tellurium based high-performance all-optical nonlinear photonic devices. Adv. Func. Mater., 29, 1806346(2019).
[13] W. Wang, Y. Wu, Q. Wu, J. Hua, J. Zhao. Coherent nonlinear optical response spatial self-phase modulation in MoSe2 nano-sheets. Sci. Rep., 6, 22072(2016).
[14] B. Shi, L. Miao, Q. Wang, J. Du, P. Tang, J. Liu, C. Zhao, S. Wen. Broadband ultrafast spatial self-phase modulation for topological insulator Bi2Te3 dispersions. Appl. Phys. Lett., 107, 151101(2015).
[15] X. Li, R. Liu, H. Xie, Y. Zhang, B. Lyu, P. Wang, J. Wang, Q. Fan, Y. Ma, S. Tao, S. Xiao, X. Yu, Y. Gao, J. He. Tri-phase all-optical switching and broadband nonlinear optical response in Bi2Se3 nanosheets. Opt. Express, 25, 18346(2017).
[16] J. Zhang, X. Yu, W. Han, B. Lv, X. Li, S. Xiao, Y. Gao, J. He. Broadband spatial self-phase modulation of black phosphorous. Opt. Lett., 41, 1704(2016).
[17] J. Li, L. Du, J. Huang, Y. He, J. Yi, L. Miao, C. Zhao, S. Wen. Passive photonic diodes based on natural van der Waals heterostructures. Nanophotonics, 10, 927(2021).
[18] L. Hu, F. Sun, H. Zhao, J. Zhao. Nonlinear optical response spatial self-hase modulation in MoTe2: correlations between χ(3) and mobility or effective mass. Opt. Lett., 44, 5214(2019).
[19] Y. Wang, G. Huang, H. Mu, S. Lin, J. Chen, S. Xiao, Q. Bao, J. He. Ultrafast recovery time and broadband saturable absorption properties of black phosphorus suspension. Appl. Phys. Lett., 107, 091905(2015).
[20] S. Xiao, Y. Ma, Y. He, Y. Wang, H. Xin, Q. Fan, J. Zhang, X. Li, Y. Zhang, J. He, Y. Wang. Revealing the intrinsic nonlinear optical response of a single MoS2 nanosheet in a suspension based on spatial self-phase modulation. Photon. Res., 8, 1725(2020).
[21] Y. Shan, J. Tang, L. Wu, S. Lu, X. Dai, Y. Xiang. Spatial self-phase modulation and all-optical switching of graphene oxide dispersions. J. Alloy. Compd., 771, 900(2019).
[22] Y. Jia, Z. Li, M. Saeed, J. Tang, H. Cai, Y. Xiang. Kerr nonlinearity in germanium selenide nanoflakes measured by Z-scan and spatial self-phase modulation techniques and its applications in all-optical information conversion. Opt. Express, 27, 20857(2019).
[23] Z. Du, H. Wu, T. Zhang, Z. Xie, Y. Lü, X. Lü, J. Xu, G. Zhao, S. Zhu. Ultra-broadband enhanced nonlinear saturable absorption for Mo0.53W0.47Te2 nanosheets. Chin. Opt. Lett., 18, 021902(2020).
[24] L. Gong, X. Zhang, Z. Zhu, G. Rui, J. He, Y. Cui, B. Gu. Femtosecond laser trapping dynamics of two-photon absorbing hollow-core nanoparticles. Chin. Opt. Lett., 18, 081901(2020).
[25] S. Hua, K. Du, H. Wang, W. Zhang, T. Mei, E. Dogheche. Affirming nonlinear optical coefficient constancy from Z-scan measurement. Chin. Opt. Lett., 18, 071903(2020).
[26] Y. Wang, H. Mu, X. Li, J. Yuan, J. Chen, S. Xiao, Q. Bao, Y. Gao, J. He. Observation of large nonlinear responses in a graphene-Bi2Te3 heterostructure at a telecommunication wavelength. Appl. Phys. Lett., 108, 221901(2016).
[27] L. Wu, X. Yuan, D. Ma, Y. Zhang, W. Huang, Y. Ge, Y. Song, Y. Xiang, J. Li, H. Zhang. Recent advances of spatial self‐phase modulation in 2D materials and passive photonic device applications. Small, 16, 2002252(2020).
[28] X.-J. Zhang, Z.-H. Yuan, R.-X. Yang, Y.-L. He, Y.-L. Qin, S. Xiao, J. He. A review on spatial self-phase modulation of two-dimensional materials. J. Central South University, 26, 2295(2019).
[29] Y. Shan, L. Wu, Y. Liao, J. Tang, X. Dai, Y. Xiang. A promising nonlinear optical material and its applications for all-optical switching and information converters based on the spatial self-phase modulation (SSPM) effect of TaSe2 nanosheets. J. Mater. Chem. C, 7, 3811(2019).
[30] L. Wu, Y. Dong, J. Zhao, D. Ma, W. Huang, Y. Zhang, Y. Wang, X. Jiang, Y. Xiang, J. Li. Kerr nonlinearity in 2D graphdiyne for passive photonic diodes. Adv. Mater., 31, 1807981(2019).
[31] L. Wu, Y. Zhang, X. Yuan, F. Zhang, W. Huang, D. Ma, J. Zhao, Y. Wang, Y. Ge, H. Huang. 1D@0D hybrid dimensional heterojunction-based photonics logical gate and isolator. Appl. Mater. Today, 19, 100589(2020).
[32] J. N. Coleman, M. Lotya, A. O’Neill, S. D. Bergin, P. J. King, U. Khan, K. Young, A. Gaucher, S. De, R. J. Smith, I. V. Shvets, S. K. Arora, G. Stanton, H.-Y. Kim, K. Lee, G. T. Kim, G. S. Duesberg, T. Hallam, J. J. Boland, J. J. Wang, J. F. Donegan, J. C. Grunlan, G. Moriarty, A. Shmeliov, R. J. Nicholls, J. M. Perkins, E. M. Grieveson, K. Theuwissen, D. W. McComb, P. D. Nellist, V. Nicolosi. Two-dimensional nanosheets produced by liquid exfoliation of layered materials. Science, 331, 568(2011).
[33] R. Wu, Y. Zhang, S. Yan, F. Bian, W. Wang, X. Bai, X. Lu, J. Zhao, E. Wang. Purely coherent nonlinear optical response in solution dispersions of graphene sheets. Nano Lett., 11, 5159(2011).

Set citation alerts for the article
Please enter your email address
© Copyright 2018-2021 | Chinese Laser Press. All Rights Reserved 沪ICP备15018463号-20